

National home value growth slows, with prices falling in nine of 20 major metro areas.
U.S. home prices rose just 1.5% in August from a year earlier — the weakest pace since 2023.
Homeowners lose ground to inflation, while easing mortgage rates offer buyers some relief.
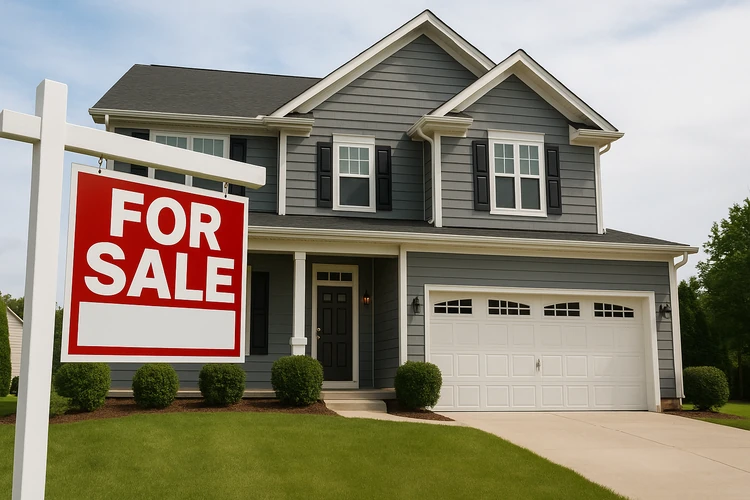
Home buyers who have remained patient and kept socking away cash are finally being rewarded. The latest data show the housing market continued to cool in August, with national home prices rising just 1.5% compared to a year earlier.
According to the latest S&P CoreLogic Case-Shiller Home Price Index, that marks a slowdown from July’s 1.7% increase and represents the slowest annual growth since 2023, when prices briefly dipped.
But perhaps more important for buyers, nine of the 20 major metro areas tracked by the index saw year-over-year price declines, signaling that the market’s post-pandemic surge continues to lose steam.
“August's data shows U.S. home prices continuing to slow,” said Nicholas Godec, head of fixed income tradables and commodities at S&P Dow Jones Indices. “For the fourth straight month, home values have lost ground to inflation, meaning homeowners are seeing their real wealth decline even as nominal prices inch higher.”
The 1.5% rise in home values trails the 2.9% inflation rate over the same period — meaning home prices are falling in real, inflation-adjusted terms.
Northeast and Midwest hold firm
The slowdown isn’t hitting all regions equally. Northeast and Midwest markets continue to post solid gains, while many Sun Belt and Western metros are seeing sharper corrections.
New York led all markets with a 6.1% annual price gain, followed by Chicago (5.9%) and Cleveland (4.7%). Meanwhile, Tampa recorded the largest drop among major metros, with values down 3.3% year-over-year — its 10th straight month of annual declines.
“Markets that experienced the sharpest pandemic-era gains are now seeing the largest corrections, while more affordable metros with stable local economies are holding up better,” Godec noted.
Realtor.com Senior Economist Anthony Smith said “markets in the Northeast and Midwest continue to perform relatively better, supported by tighter resale supply and steadier demand,” while many Sun Belt cities “are showing clearer signs of softening, with inventory recovering, homes taking longer to sell, and price cuts rising.”
Cooling prices, falling mortgage rates
For prospective buyers, the silver lining shines even brighter. Mortgage rates have fallen to their lowest level in over a year — 6.19%, according to Freddie Mac — as the Federal Reserve continues to ease its benchmark interest rate.
With inflation outpacing home value growth, falling borrowing costs, and a patchwork of local market conditions, the housing market appears to be entering a new equilibrium — one that could offer opportunities for patient buyers while testing the resilience of homeowners who bought at the peak.