Where are Americans most cost-burdened by groceries?
+2 more

It’s Sunday afternoon and you’re heading to the supermarket. Are you focused on your grocery list and meal prep for the week ahead? Or does the anticipation of a steep grocery bill fill you with dread?
Amid inflation, tariffs and supply-side disruptions, consumers are feeling the strain as grocery prices rise — and even skyrocket on occasion (e.g., eggs). And if your checking account is getting hit hard at the checkout line, you’re not alone.
“The impact is widespread,” said Erica Parker, managing director at The Harris Poll. In a recent survey by Harris and Axios, nearly half of respondents (47%) said it is harder to afford groceries now than it was a year ago, while just 19% say it is easier.
From September 2024 to September 2025, food prices rose 3.1% — up from the previous year, according to the Bureau of Labor Statistics.
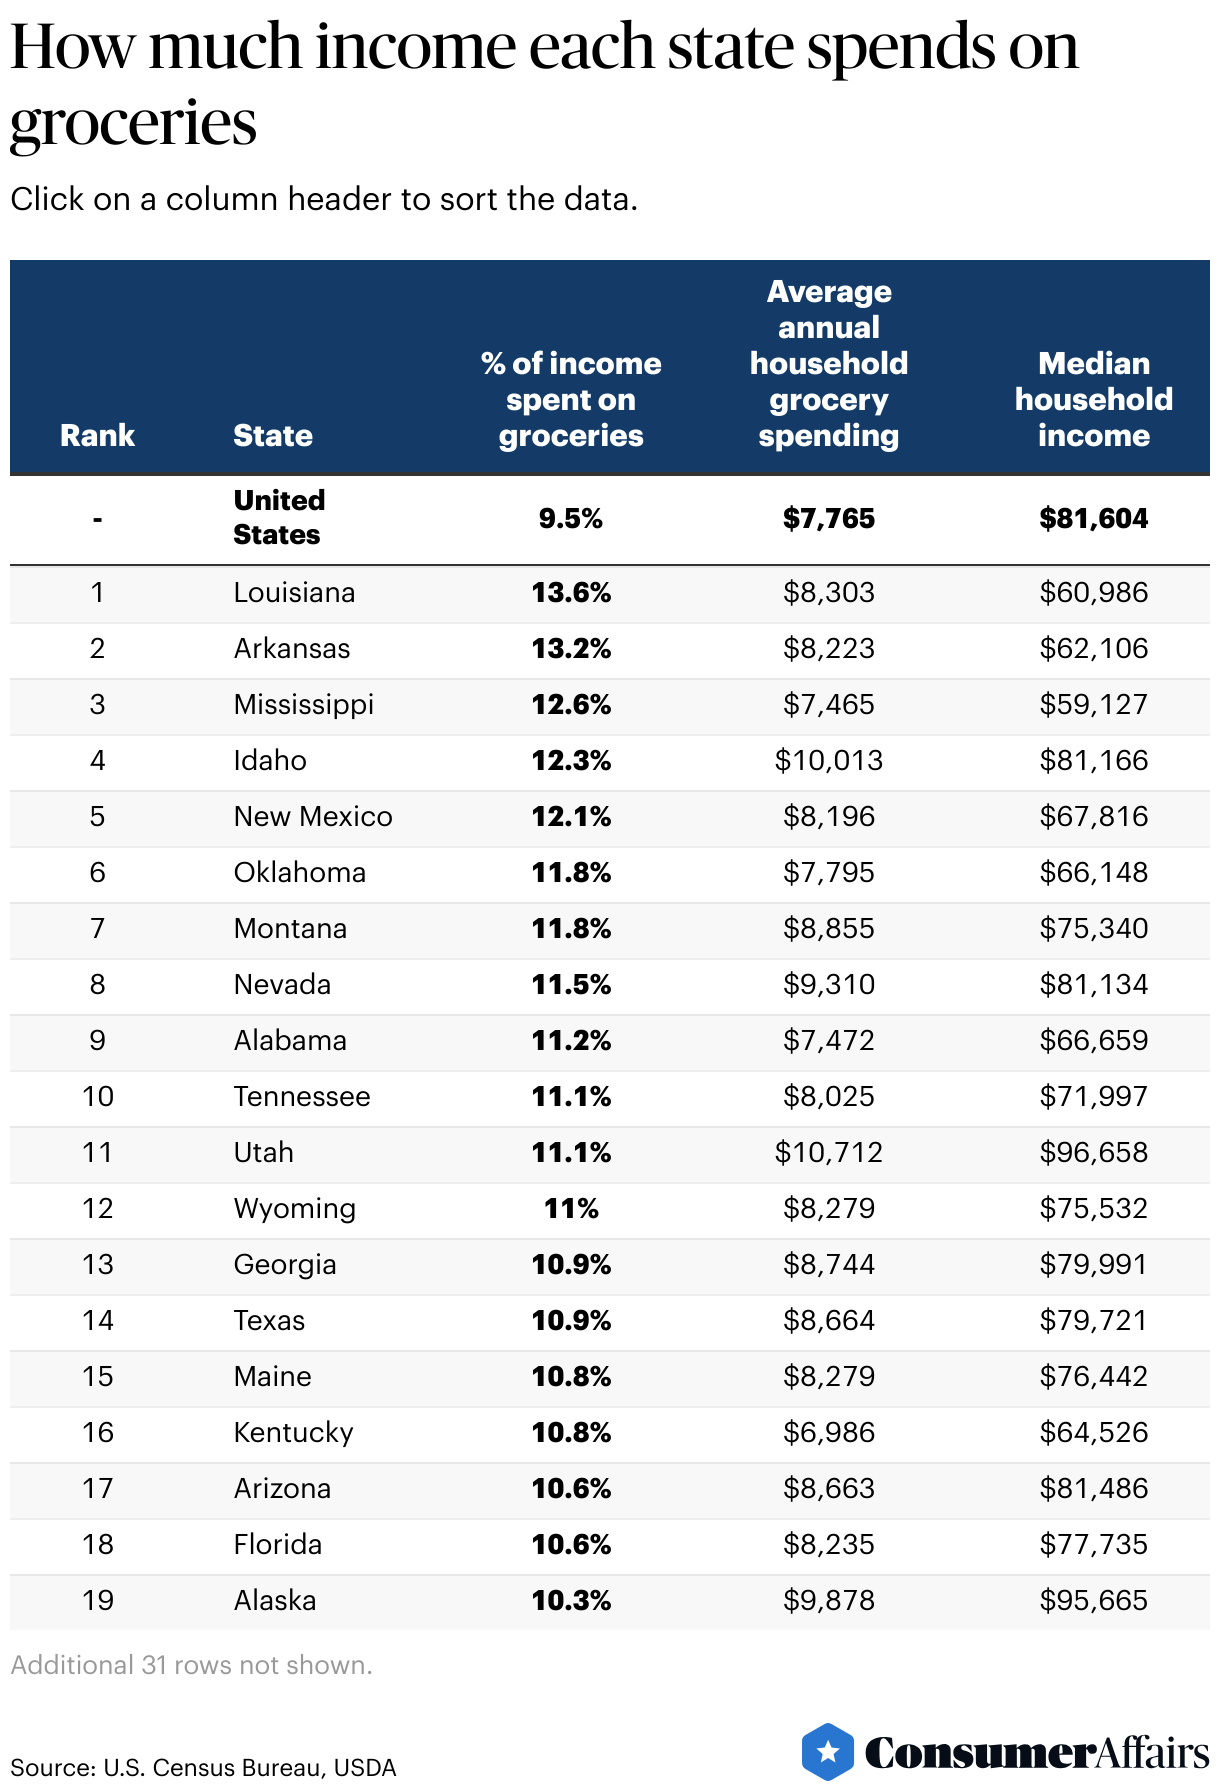
To find out where Americans are the most financially burdened by the cost of groceries, the ConsumerAffairs Research Team compared each state’s median household income with its average annual grocery spending. Read on to learn more about the data — and the narrative beneath the numbers — so you’re more empowered next time you reach the checkout line.
Louisiana residents are the most cost-burdened by grocery spending, with the typical household spending about 13% of its income on groceries.
Jump to insightMassachusetts residents spend the smallest share of their income on groceries, at just 6.7%. Annual grocery costs aren’t cheap — about $7,071 — but the state has one of the highest median incomes in the U.S.
Jump to insightUtah, which ranks 11th highest for percentage of income spent on groceries, has the highest grocery costs, at about $10,712 each year.
Jump to insightIn all 10 of the most grocery cost-burdened states, the median household income is below the national median of $81,604.
Jump to insight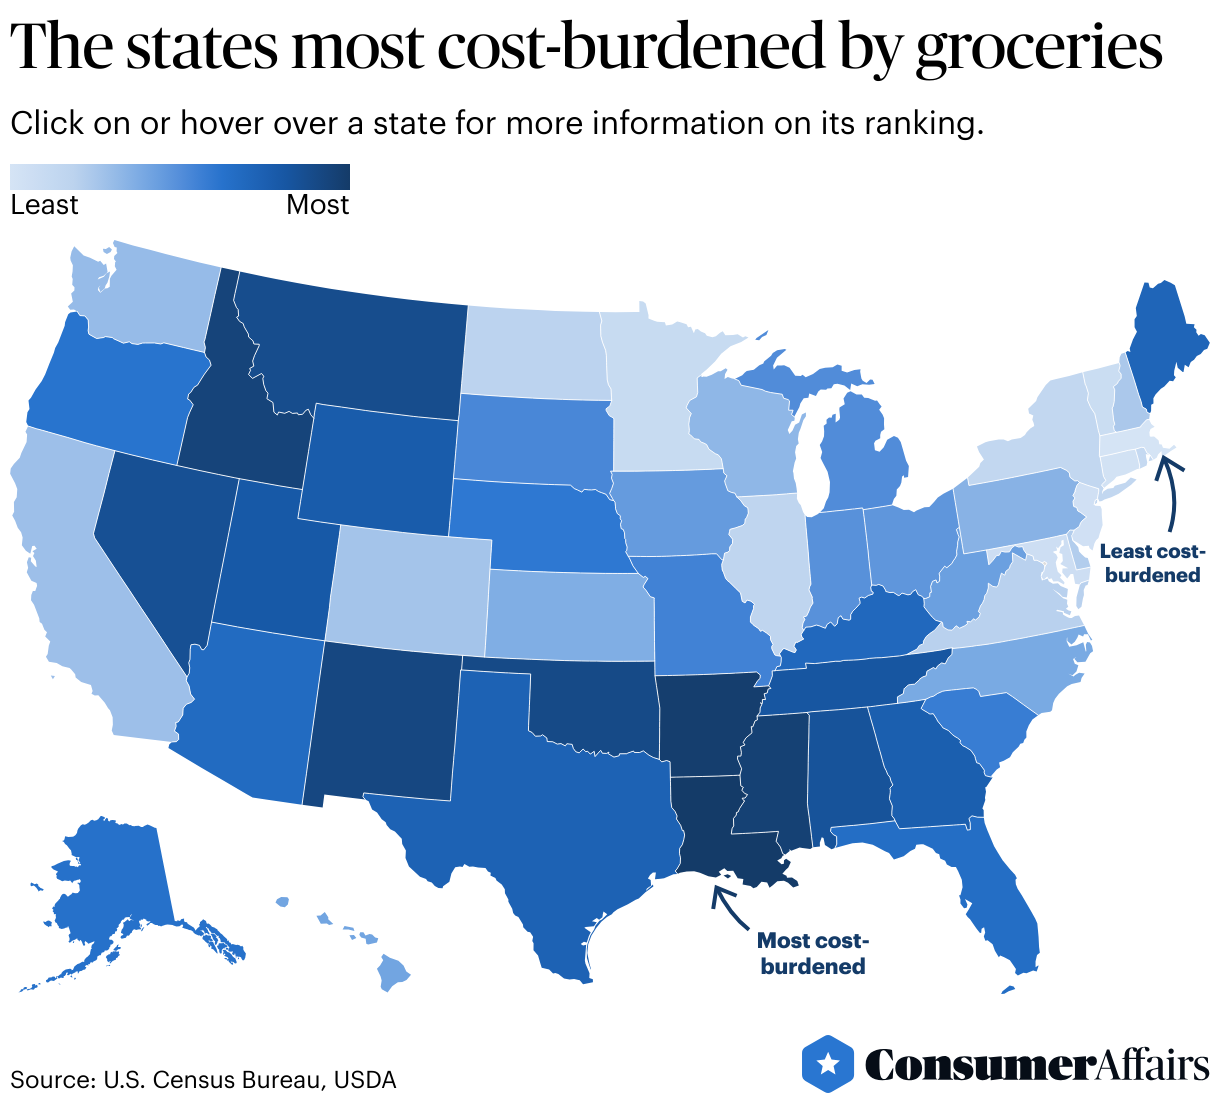
Read on for a closer look at the five states where groceries are the biggest burden:
1. Louisiana
Landing at the top of the list for grocery cost burden is Louisiana. Louisianan households spend almost $692 a month at the grocery store. That’s 7% more than what the typical American household spends. (To put things in perspective, $692 is also almost two-thirds of the typical rent in Louisiana as of 2025.)
However, Louisiana’s top rank isn’t because its residents spend the highest dollar amount on groceries. Rather, household incomes tend to be much lower, which means that grocery bills hit harder. The typical Louisiana household spends almost a dollar on groceries for every $7 earned. Ultimately, households in the Pelican State are 43% more cost-burdened by groceries than the typical American household.
Louisiana faces broader issues of affordable, accessible food. About 804,000 Louisianans participate in the Supplemental Nutrition Assistance Program (SNAP), according to U.S. Department of Agriculture figures. In 2024, more than 18% of Louisianans received SNAP benefits — that’s almost 1 in 5 people, putting Louisiana among the top states for SNAP participation.
Check out these key metrics:
- Average annual grocery spending per household: $8,303
- Median household income: $60,986
- Percentage of income spent on groceries: 13.6%
2. Arkansas
Just a hair behind Louisiana is Arkansas, where the typical household spends $685 on groceries each month. Incomes in Arkansas, as in Louisiana, are far below the national median. Households in the Natural State are 39% more cost-burdened by groceries than the typical American family.
However, state leaders are taking steps to try and ease this burden for Arkansans, if only by a small margin. In April 2025, Gov. Sarah Huckabee Sanders signed into law a grocery tax exemption; the repeal of the 0.125% state tax on groceries goes into effect on Jan. 1, 2026.
Key metrics:
- Average annual grocery spending per household: $8,223
- Median household income: $62,106
- Percentage of income spent on groceries: 13.2%
3. Mississippi
The Magnolia State ranks third worst for grocery cost burden: Mississippians spend $1 of every $8 they earn on groceries. That amounts to $622 a month at the grocery store. In total, almost 27% of income goes to combined household food costs (groceries and dining out) — the fourth highest of all states.
Mississippi households actually spend $300 less on groceries than the typical American household. And they spend slightly less on groceries than they did last year. But with household incomes so tight, even a moderate grocery bill makes a sizable dent. The median household income is less than $60,000 — that’s the lowest in America, and 28% lower than the national median.
Ultimately, Mississippi families are almost 33% more cost-burdened by groceries than the typical American household.
Key metrics:
- Average annual grocery spending per household: $7,465
- Median household income: $59,127
- Percentage of income spent on groceries: 12.6%
4. Idaho
Compared with the other states in the top five, Idaho is a bit of an outlier. It’s the first non-Southern state in the top five, and the highest-ranking Western state. At $81,166, the median income in the state is significantly higher than the other top-ranked states (though still slightly below the national median).
And annual grocery spending in the state isn’t just high — at $834 a month, it’s the second-highest in the nation. (It’s climbed gradually in that metric over the last five years; Idahoans spent the sixth most on groceries in 2019, and the third most in 2023.) Among the five most cost-burdened states, Idaho is also the top spender on all food (groceries and dining out), at $18,209 a year, ranking 16th highest in that metric.
And it’s not just sticker prices that are high; taxes add an additional cost to grocery store purchases. Idaho is one of just four states that maintain a standard sales tax rate for groceries. At 6%, it’s the second highest in the country, behind only Mississippi, another state with a high cost burden from groceries.
Ultimately, households in Idaho are about 30% more cost-burdened by groceries than the rest of the nation.
Key metrics:
- Average annual grocery spending per household: $10,013
- Median household income: $81,166
- Percentage of income spent on groceries: 12.3%
5. New Mexico
It may be the Land of Enchantment, but residents are more likely to be disillusioned with the cost of groceries. New Mexico has the fifth-worst cost burden for groceries, with households spending more than 12% of income on food at home — about $683 a month. That means a household in New Mexico is 27% more cost-burdened by groceries than a typical American family.
However, like in Arkansas, elected officials in New Mexico are aware of the problem. Lawmakers have proposed creating a commission to strategize about reducing grocery costs and submit a report of recommendations to the governor.
Key metrics:
- Average annual grocery spending per household: $8,196
- Median household income: $67,816
- Percentage of income spent on groceries: 12.1%
Which states are least cost-burdened by groceries?
While groceries present a steep burden in some areas, that’s not the case nationwide. In some states, residents can better afford the costs.
At the top of this list is Massachusetts, where residents spend the smallest slice of their income on groceries (just 6.7%). The typical household spends about $7,071 per year on groceries, which is about $700 less than the national average. The high median household income in Massachusetts ($104,828, the highest in the country) helps offset the expense even further.
The 10 states where groceries present the least financial burden are:
- Massachusetts
- Connecticut
- New Jersey
- Maryland
- Vermont
- Minnesota
- Rhode Island
- New York
- Illinois
- North Dakota
It’s worth noting that several of these states are known for a generally high cost of living. In particular, Connecticut, New Jersey, Vermont and New York rank among the 10 most expensive states in our latest cost of living analysis, with Massachusetts, Maryland and Rhode Island ranking in the top half of states. That might make it somewhat surprising that residents in these states spend a smaller portion of their income at the grocery store.
However, this might be balanced out by higher spending on food outside the home. In the 10 states listed directly above, the typical household spends an average of 59% of total food spending outside the home; in the 10 states most burdened by grocery prices, the average is 53%.
How much each state spends on groceries
Just as the price of eggs can vary widely from store to store or town to town, the cost burden of groceries varies across locations. While the states that spend the highest raw dollar amount at the supermarket are concentrated in the West (nine of the top 10 states), the states with the steepest cost burden are split between the South and the West (six in the South, four in the West). At the other end of the spectrum, the Northeast supplies six out of the 10 least cost-burdened states.
A few individual states stand out in the data for other reasons. Consider Utah: The state ranks 11th worst for overall grocery cost burden, but it has the highest annual household grocery costs of any state ($10,712). This high dollar amount may be related to the fact that Utah has the largest average household size of any state — 2.91 people, compared with the national average of 2.5.
For the state where spending has grown the most in recent years, look to Tennessee (ranked 10th overall for cost burden). From 2019 to 2024, household grocery spending in the Volunteer State increased by a staggering 37%. In 2019, Tennesseans actually spent about 7% less than the national average on groceries. Now, a typical family there spends $8,025 a year at the grocery store, 3% above the average.
To see where your state lands, take a look at the data below.
What about food stamps (SNAP)?
The Supplemental Nutrition Assistance Program, or SNAP, is the largest food and nutrition assistance program in the U.S. It provides eligible low-income individuals and families with a monetary benefit for groceries, and it can only be used on eligible food and beverages (not on alcohol, tobacco, nonfood items or, in most cases, prepared food). It’s funded by the federal government and administered by the states.
To better understand how SNAP factors into grocery spending across the U.S., we spoke with Parke Wilde, a professor and food economist at the Friedman School of Nutrition Science and Policy at Tufts University.
“The SNAP benefit is elevated for consumers in Alaska and Hawaii, which have atypically high food prices,” Wilde said. “Within the continental United States, there is no adjustment for local prices, so in practice, (SNAP) participants on the East and West coasts can afford less food with their benefits compared to people in places with lower food prices.”
Indeed, typical monthly SNAP benefits range from as low as $157 in Minnesota — one of the least cost-burdened states — to as high as $305 in Alaska and $377 in Hawaii.
“Most years, I tell people that food price inflation especially hurts low-income consumers who are not on the Supplemental Nutrition Assistance Program (SNAP), while the SNAP participants are comparatively well protected from price inflation, because SNAP benefits have an automatic cost-of-living increase,” said Wilde.
In late 2025, however, we’re facing a different set of circumstances, as the government shutdown brought into question whether SNAP will continue to be funded. “The cost of living increase (for the SNAP benefit) is only 1.9%, which is less than food price inflation in the most recent 12 months,” he said.
What contributes to hikes in grocery prices?
“When we talk about grocery prices rising, we are usually talking about what's going on at our local stores, but the truth is, problems start much earlier in the process,” said Eran Mizrahi, CEO of Source86, a global sourcing and private-label solutions partner in the food industry. The cost of ingredients — especially imported ones — plus the costs of transportation, fuel and packaging materials can all contribute to the upward creep, he explained.
“These are not just random jumps in prices; it's actually the result of months and months of cost pressures finally catching up.”
“These are not just random jumps in prices; it's actually the result of months and months of cost pressures finally catching up,” Mizrahi said.
Another factor that’s pushing prices up: the changing climate.
“Cocoa and coffee are the clearest examples of climate stress showing up in your grocery bill,” said Francisco Martin-Rayo, CEO of Helios, an artificial intelligence platform that predicts supply chain and price fluctuations for agricultural commodities. In early 2025, beverage prices hit record highs due to weather-related production shortfalls in places like West Africa and Latin America, Martin-Rayo explained. Those increased supply costs “filter into the consumer aisle with a lag,” he said.
Even if supply chain disruptions weren’t a factor, “stores are always adjusting their prices on a daily basis to compete with rivals, which is what creates the sales and price changes consumers see every week,” said Serge Salager, CEO of Visualping, an AI-powered tool that can track local grocery prices and let users set price drop alerts. Some grocers are also using dynamic pricing — that’s “where prices automatically change based on real-time demand, rising when an item is popular and dropping when it’s not,” Salager said.
How to watch your wallet at the grocery store
There are steps you can take to help reduce your grocery bill each month, but it’s critical to remember that supermarket prices aren’t the only factor determining the cost burden of groceries. Income is the other key variable — perhaps the more significant determinant. One example: In all 10 of the most grocery cost-burdened states, the median household income is below the national median of $81,604.
“The job market has softened, and wages are not keeping pace as they once did,” said Parker, the managing director at The Harris Poll. “Every grocery trip takes a bigger bite out of household budgets.”
While the following tips won’t magically give you more dough, they can help you stretch what you have so it goes further — and think outside the box for where you get your groceries.
- Make a shopping list — and stick to it. Impulse buys can quickly turn a “five items or fewer” shopping trip into an expensive haul. Take stock of what really fits into your household’s food budget, and don’t budge on it.
- At the same time, don’t let a strict plan make you skip meaningful deals. Leave room in your weekly grocery budget to take advantage of buy-one-get-one (BOGO) deals on your pantry staples. Take a moment each trip to swing through the discount and last-run aisles for deep discounts, too.
- Buy generic and store brands. While this isn’t the flashiest tip, it adds up — literally. Choosing generic and store brands over name-brand pantry items can mean big cost savings of 40%, according to some estimates. Extrapolated over a year, that’s comparable to the spending difference between households in Utah ($10,712 on groceries a year) and North Dakota ($6,439).
- Think sustainable. Many consumers are turning to sustainable options like “ugly produce” boxes, microhomesteading or local co-ops to cut their grocery bill. “These small, sustainable steps — like growing herbs on patios or sharing community gardens — give people both savings and a sense of control” amid the emotional and financial stress of “grocery fatigue,” said Shampaigne Graves, founder of Boldifi, a women-focused consumer behavior agency.
- Don’t be afraid to seek help. In October and November 2025, amid uncertainty around funding for SNAP benefits, many communities have rallied to support food banks and amplify resources for cheap or no-cost groceries. If your weekly grocery trip teeters from a mild budget strain to a financial crisis, check out a site like findhelp.org to locate food assistance programs and free or reduced-cost food near you.
Methodology
The ConsumerAffairs Research Team analyzed grocery spending and income data to identify which states have households that are most cost-burdened by grocery expenses.
We used 2024 U.S. Department of Agriculture data on food-at-home sales per capita to represent individual grocery spending. To estimate household grocery costs, we multiplied that amount by the average household size in each state, as reported by the U.S. Census Bureau for 2024.
We then divided each state’s estimated household grocery spending by its median household income (U.S. Census Bureau, 2024) to determine the share of income spent on groceries. States were ranked based on this percentage.
For additional context, we gathered data on grocery spending in 2023 and 2019 to calculate one- and five-year changes, along with each state’s total food spending and food-away-from-home spending for comparison. These figures were included for storytelling purposes only and were not factored into the ranking.
Reference policy
We love it when people share our findings! If you do, please link back to our original article to credit our research.
Questions?
For questions about the data or if you'd like to set up an interview, please contact ljobe@consumeraffairs.com.
Article sources
ConsumerAffairs writers primarily rely on government data, industry experts and original research from other reputable publications to inform their work. Specific sources for this article include:
- U.S. Census Bureau, “Food Expenditure Series - Interactive Charts: Food Expenditures.” Accessed Nov. 3, 2025.
- U.S. Department of Agriculture, “Total food sales across States in 2024, per capita.” Accessed Nov. 3, 2025.
- Axios, “Axios Vibes: Grocery price pain rises, in warning sign for Trump and GOP.” Accessed Nov. 3, 2025.
- U.S. Bureau of Labor Statistics, “Consumer Price Index Summary.” Accessed Nov. 3, 2025.
- U.S. Bureau of Labor Statistics, “Consumer Price Index News Release.” Accessed Nov. 3, 2025.
- U.S. Department of Agriculture, “SNAP Data Tables.” Accessed Nov. 3, 2025.
- Center on Budget and Policy Priorities, “A Closer Look at Who Benefits from SNAP: State-by-State Fact Sheets.” Accessed Nov. 3, 2025.
- Arkansas State Legislature, “HB1685 Bill Information.” Accessed Nov. 3, 2025.
- Arkansas Governor, “Bills Signed.” Accessed Nov. 3, 2025.
- Arkansas Department of Finance and Administration (DFA), “State Sales & Use Tax Rates.” Accessed Nov. 3, 2025.
- Stripe, “What is each US state’s grocery tax?” Accessed Nov. 3, 2025.
- New Mexico Legislature, “2025 Regular Session - HB 17.” Accessed Nov. 3, 2025.
- Johns Hopkins Bloomberg School of Public Health, “What Is SNAP? And Why Does It Matter?” Accessed Nov. 3, 2025.
- U.S. Department of Agriculture, “Supplemental Nutrition Assistance Program (SNAP).” Accessed Nov. 3, 2025.
- KFF, “Average Supplemental Nutrition Assistance Program (SNAP) Benefits Per Person.” Accessed Nov. 3, 2025.
- World Bank Group, “April 2025 Commodity Markets Outlook.” Accessed Nov. 3, 2025.
- World Bank Group, “Beverage prices soften but risks are brewing.” Accessed Nov. 3, 2025.
Figures