2024 Housing Market Trends

Article Image

The housing market saw modest growth in December

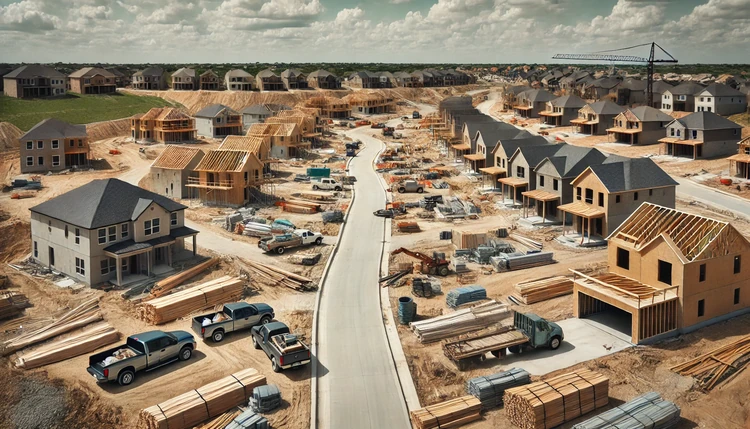
Mortgage rates may remain elevated in 2025 but the latest report from real estate broker Redfin hints at a slight improvement in the housing market for buyers in the new year. After years of declining inventory, there may be more homes to choose from.

The report shows active home listings climbed 12% year-over-year during the four weeks ending December 22, 2024. It’s the smallest increase since March but it shows inventory levels are moving in a positive direction. Redfin says seasonal effects hearing into the holidays may have subdued new listings.

Despite the holiday lull, the housing market continues to show resilience. The median sale price of homes rose by 6% to $383,725, while the median asking price increased by 5% to $376,000. That’s better news for sellers than buyers.

Unfortunately, the median monthly mortgage payment also rose, reaching $2,519 at a 6.85% mortgage rate, up 7.1% from the previous year.

The Redfin Homebuyer Demand Index, which measures tours and other homebuying services, remained stable from the previous month but showed a 4% increase year-over-year. However, touring activity has decreased by 52.9% from the start of 2024, a slight improvement from last year's 57.7% drop.

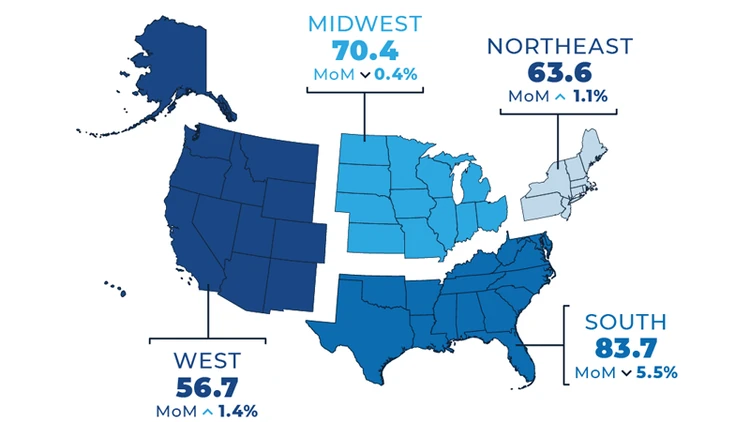
In terms of regional performance, Philadelphia led the nation with a 17.1% increase in median sale prices, followed by Milwaukee and Cleveland. Conversely, San Antonio experienced the most significant decline in pending sales, dropping by 17.4%, with Orlando and Houston also seeing notable decreases.

Where listings are increasing

New listings remained flat nationally, but some metros like Oakland and Las Vegas saw increases of 9% and 8.9%, respectively. Meanwhile, San Antonio and Nassau County, N.Y., faced the steepest declines in new listings.

As the market navigates through the holiday season, Redfin said it anticipates a return to more predictable market after the holidays. For now, the data suggest a balanced market with a months-of-supply figure at four, indicating neither a strong buyer's nor seller's market.

Overall, while the housing market shows signs of seasonal slowdown, the underlying demand and price growth indicate continued strength heading into the new year.

Article Image

Mortgage rates are still rising, getting close to 7%

As we head into 2025, mortgage rates appear headed back to 7%. Freddie Mac reports its Primary Mortgage Market Survey shows the 30-year fixed-rate mortgage (FRM) averaged 6.85% this week, increasing home affordability challenges.

“Mortgage rates increased for the second straight week, rebounding after a decline from earlier this month,” said Sam Khater, Freddie Mac’s chief economist. 

“While a slight improvement in new and existing home sales is encouraging, the market remains plagued by an overwhelming undersupply of homes. A strong economy can help build momentum heading into the new year and potentially boost purchase activity.”

While rates are expected to remain high next year, they may stay below 7% much of the time. An economic forecast from real estate marketplace Realtor.com suggests the 30-year fixed-rate mortgage will average 6.3% throughout the year.

While 6.3% is not historically high for a mortgage, the rate averaged 4% from 2013 to 2019. However, rates plunged to below 3% during the COVID-19 pandemic, causing home prices to skyrocket.

Realtor.com expects home prices to continue rising in 2025, increasing by 3.7%. The shortage of available homes has not reduced demand, keeping prices elevated.

Article Image

Should you buy an existing home or a new one?

With high home prices and still rising mortgage rates, finding an affordable house can be a challenge. But when it comes to looking for a home, buyers first have to make a decision – buy an existing home or a newly-constructed one being sold by a builder?

Existing homes are normally less expensive than new ones, but there could be some advantages to a newly-built home, other than the fact that everything in the house is new. To sell their homes, builders are increasingly offering incentives, including buying down the mortgage rate.

While the average 30-year fixed-rate mortgage is now around 6.75%, some home builders are offering rates as low as 5%, making the monthly payment more affordable. And the number of builders doing this appears to be growing.

New home sales in November reached a seasonally adjusted annualized rate of 740,636, marking a 15.7% increase from the previous year and a 17.0% rise from 2019 levels. Ali Wolf, chief economist at Zonda, which tracks U.S. home construction, emphasized the role of incentives in driving these sales, particularly for larger builders. 

"Our data captured that 75% of all new home projects were offering some kind of incentive on quick move-in supply," Wolf said. "The important difference seen in November, though, was a lift in consumer confidence. The election was over – it was time to move on."

Other incentives

Mortgage rate buydowns are just one incentive builders may offer. Some are offering assistance with closing costs by covering some or all of the closing costs associated with purchasing a new home. 

Builders may also offer appliance or fixture upgrades and provide buyers with credits that can be used for home design upgrades, allowing them to customize their new homes to their preferences.

In addition to the rise in new home sales, rthe latest existing home sales report from the National Association of Realtors showed a sharp increase in November sales. The median home sale prices also continued to rise, perhaps sending a signal to buyers that waiting for lower prices and mortgage rates may be costly.

Article Image

Existing home sales jumped nearly 5% in November

The U.S. housing market experienced a significant uptick in existing home sales in November. The National Association of Realtors reports sales increased by 4.8% from October, reaching a seasonally adjusted annual rate of 4.15 million, the fastest pace observed since March 2024. 

Sales were up 6.1% compared to November 2023, the largest year-over-year gain since June 2021. Sales rose despite mortgage rates that fluctuated between 6.5% and 7%.

As the number of sold homes rose, so did their price. The median price for existing homes increased by 4.7% from the previous year to $406,100. This marks the 17th consecutive month of year-over-year price increases, reflecting sustained demand in the housing market in spite of higher mortgage rates.

Inventory levels, however, showed a slight decline. The total inventory of unsold existing homes decreased by 2.9% from October, settling at 1.33 million units by the end of November. This represents a 3.8-month supply at the current sales pace, a decrease from the 4.2-month supply recorded in October, but an increase from the 3.5-month supply in November 2023.

"Home sales momentum is building," said Lawrence Yun, NAR's chief economist. "More buyers have entered the market as the economy continues to add jobs, housing inventory grows compared to a year ago, and consumers get used to a new normal of mortgage rates between 6% and 7%."

Sales grew in three regions of the country

The growth in sales was observed across three major U.S. regions, with the West maintaining steady levels. Year-over-year, all four regions reported increased sales, highlighting a broad-based recovery in the housing market.

Existing homeowners are leveraging the substantial $15 trillion rise in housing equity over the past four years, seeking homes that better suit their evolving life circumstances, according to Yun.

As the market adapts to these changes, NAR says the continued rise in home prices and sales suggests a robust demand, despite the challenges posed by fluctuating mortgage rates. The housing market's resilience is a positive indicator for the broader economy, reflecting consumer confidence and economic stability.

Article Image

The average mortgage rate rose again this week

Mortgage rates appear stuck in a range between 6% and 7%. Freddie Mac reports its Primary Mortgage Market Survey shows the 30-year fixed-rate mortgage (FRM) averaged 6.72% this week, after falling to as low as 6.09% in October. 

“This week, mortgage rates crept up to a similar average as this time in 2023,” said Sam Khater, Freddie Mac’s chief economist. 

“For the most part, mortgage rates have moved between 6 and 7 percent over the last 12 months. Homebuyers are slowly digesting these higher rates and are gradually willing to move forward with buying a home, resulting in additional purchase activity.”

Not historically high but high enough

Even though current mortgage rates are not historically high, they pose affordability challenges for would-be homebuyers. That’s because historically low mortgage rate three and four years ago inflated the value of home. And that inflation continues.

As it reports sales of existing homes rose almost 5% in November, the National Association of Realtors noted that home prices continue to rise. The median price for existing homes increased by 4.7% from the previous year to $406,100. 

This marks the 17th consecutive month of year-over-year price increases, reflecting sustained demand in the housing market in spite of higher mortgage rates.

Article Image

After falling, the cost of rent is rising again

After a surge in apartment construction, various data this year showed the cost of rent was declining while home prices continued to rise. But, in a surprising turn for the U.S. rental market, asking rents for newly constructed apartments have risen by 1.5% in the third quarter of 2024, marking the largest year-over-year increase in 18 months. 

According to a new report by real estate brokerage Redfin, the median rent for these new apartments has climbed back above $1,800, reaching $1,802. This rebound follows two quarters of significant declines, where rents fell by more than 7%, hitting a low of $1,714 in the second quarter—the lowest since mid-2021.

However, the rental landscape varies significantly across regions, and even housing markets. The Northeast experienced a 3.6% decline in asking rents, despite a 13% increase in new apartment completions, the highest since late 2022. 

The West saw the most substantial rent increase at 4.4%, alongside a 34.1% surge in new apartment completions. The Midwest reported a 3.3% rise in rents following a 47% increase in new apartments, while the South, which saw nearly as many new completions as the other regions combined, recorded a modest 1.1% rent increase.

Location may be a big influence

Redfin Senior Economist Sheharyar Bokhari noted the unexpected rise in rents despite the influx of new apartments, attributing it to construction in more expensive metropolitan areas. 

"We would usually predict that rents will stay flat, or even potentially fall, when there are so many new apartment buildings opening up," Bokhari said. "This is likely due to more new apartments being built in more expensive metros in each region, pushing the overall levels up."

A separate Redfin report highlights a slowdown in the absorption rate of new apartments, with just 52% rented within three months of completion in the second quarter. This rate, the second-lowest since mid-2020, reflects a return to pre-pandemic levels of 50-55%, as the market adjusts to the construction boom that followed pandemic-driven demand spikes.

The national rental vacancy rate for buildings with five or more units reached 8% in the third quarter, the highest since early 2021, indicating that supply continues to outpace demand, which ordinarily would lead to lower rent. However, construction is slowing, with Census data showing a nearly 20% decline in new apartments under construction and permits issued compared to the previous year.

Article Image

New mortgages down sharply, by about a third, annual report shows

There has been a significant decline in mortgage lending in 2024, according to the Consumer Financial Protection Bureau (CFPB), which released its annual report on trends in the mortgage market today.

Both loan applications and originations fell by about a third from 2022, with refinancing activity experiencing a sharper drop, especially for single-family homes. In fact, refinancing originations were down nearly two-thirds from 2022.

The number of mortgage applications decreased by about 4.3 million, or 30.3%, from 2022, while originations decreased by 2.7 million, or 32.2%.

Refinancing of single-family homes fell by 64%. Most of the refinance originations left in the market were a small number of cash-out refinance loans.

Rising interest rates contributed to higher monthly mortgage payments, with the average payment for a 30-year fixed-rate mortgage increasing by $250 from December 2022 to December 2023. Despite this, the average debt-to-income ratio for home purchases stayed stable, likely due to lenders focusing on higher-income borrowers.

In 2023, more than half of all borrowers paid discount points, with a significant increase from 2022. Additionally, the median total loan costs rose for both home purchase and refinance loans.

Notably, Hispanic and Black borrowers saw the largest increases in loan costs.

Independent mortgage companies continued to dominate the market, originating more loans than banks or credit unions. The report also found that the median total loan costs for refinance loans saw a sharp rise compared to home purchase loans.

The report highlights key shifts in the mortgage market, including the rise of non-depository institutions and the growing burden of rising costs on borrowers.

Article Image

A wave of baby boomer home sales probably won’t resolve the housing shortage

Even before the COVID-19 pandemic, the U.S. housing market has been out of balance, with demand outstripping the supply of single-family homes. The pandemic, with its remote work opportunities, just made it worse.

This year, housing inventory finally started to improve, but even with millions of baby boomers downsizing, the homes that are expected to sell in the next few years, in what real estate marketplace Zillow calls a “silver tsunami,” won’t help that much because these homes aren’t where young families want to be.

Zillow data show that in 2022, there were approximately 20.9 million empty-nest households nationwide. These households consist of residents aged 55 or older who have lived in the same home for over a decade, have no children at home, and possess at least two extra bedrooms. 

This figure contrasts sharply with the 8.1 million families living with nonrelatives who likely need their own space.

According to Zillow researchers, the issue lies in the geographic distribution of these empty-nest homes. They are predominantly located in less expensive markets, which are not the preferred destinations for young workers. 

Pittsburgh has the most empty-next homes

Among the 50 largest U.S. metropolitan areas, Pittsburgh leads with the highest share of empty-nest households at 22%, followed by Buffalo and Cleveland at 20%, Detroit and St. Louis at 19%, and New Orleans at 18%. 

These cities, except for New Orleans, are already among the top markets with affordable homes and have a lower proportion of household heads under the age of 44.

At the same time, cities like San Jose, Austin, and Denver, which attract a significant number of millennials and Gen Zers, are among the most expensive in the nation. These areas have a smaller share of empty-nest households than the national average, exacerbating the housing affordability challenge. 

The high demand in these coastal job centers means that an influx of homes from older owners, often referred to as a silver tsunami, would have a limited impact on easing affordability pressures.

The problem with new construction

Zillow's research suggests the key to resolving the housing shortage lies in building more homes. But markets with severe housing shortages often face stringent land-use restrictions, which hinder new construction and make it more expensive. 

Promoting denser construction and removing barriers to homeownership, such as providing credit assistance, down payment help, and closing cost support, could improve access to housing, researchers say.

"Even if we did see a 'silver tsunami,' a look at the map tells me it wouldn't really move the needle in terms of solving our housing affordability crunch," said Orphe Divounguy, Zillow’s senior economist. "These empty-nest households are concentrated in more affordable markets, where housing is already more accessible — not in the expensive coastal job centers where young workers are moving and where more homes are most desperately needed."

A wave of baby boomer home sales probably won’t resolve the housing shortage because Zillow data show these homes aren’t where the jobs are.

Article Image

These states reversed migration in 2023

People moving from one state to another fell sharply in 2023, but most states still brought in more people than they lost.

Nearly 7.6 million people moved out of state in 2023 versus around 8.2 million in 2022, marking the lowest level within the last four recorded years, according to the latest state migration data from the U.S. Census Bureau.

The decline in people moving between states follows a surge in state-to-state migration spurred by the pandemic, which caused layoffs and let more people get remote jobs that allowed them to move more freely.

Since then, working from home has become rarer after companies increasingly enforced return-to-the-office policies, making it more difficult to move between states and reap the financial benefits of living in more affordable locations.

Still, most U.S. states in 2023 had positive inflows of people from other states and there were a handful where migration switched from negative to positive, or vice versa.

ConsumerAffairs analyzed the Census’s state-to-state migration flows data to find which states have seen a positive or negative change in migration, found by subtracting the number of people who moved in from people who moved out in 2023.

Where did state-to-state migration turn positive or negative in 2023?

There were four states where migration turned positive, six that turned negative, 26 that stayed positive and 14 that stayed negative.

States where there was a switch between positive and negative migrations of people include Virginia, Colorado, Kansas and New Mexico.

Mapping of the migration data also shows that more expensive states on the West Coast and Northeast continued to lose people in 2023, while more affordable states in the South kept gaining.

The states where state-to-state migration turned positive in 2023

The four states where state-to-state migration turned positive in 2023 versus 2022 were Colorado, Hawaii, Virginia and Wisconsin.

Below is a ranking of the four states where migration turned positive, based upon the difference between 2023 and 2022.

  1. Virginia had positive migration of 22,921 people in 2023, versus a negative 15,080 people in 2022. That’s a difference of 38,001 people.
  2. Colorado had positive migration of 21,293 people in 2023, versus a negative 9,324 people in 2022. That’s a difference of 30,617 people.
  3. Wisconsin had positive migration of 14,853 people in 2023, versus a negative 895 people in 2022. That’s a difference of 15,748 people.
  4. Hawaii had positive migration of 461 people in 2023, versus a negative 9,324 people in 2022. That’s a difference of 11,509 people.

The states where state-to-state migration turned negative in 2023

The six states where state-to-state migration turned negative in 2023 versus 2022 were Alaska, Iowa, Kansas, Montana, New Hampshire and New Mexico.

Below is a ranking of the four states where migration turned negative, based upon the difference between 2023 and 2022.

  1. Kansas had negative migration of 15,575 people in 2023, versus a positive 9,650 people in 2022. That’s a difference of 25,225 people.
  2. New Mexico had negative migration of 244 people in 2023, versus a positive 13,652 people in 2022. That’s a difference of 13,896 people.
  3. Montana had negative migration of 47 people in 2023, versus a positive 9,682 people in 2022. That’s  a difference of 9,729 people.
  4. New Hampshire had negative migration of 7,058 people in 2023, versus a positive 2.916 people in 2022. That’s a difference of 9,974 people.
  5. Alaska had negative migration of 5,124 people in 2023, versus a positive 3,808 people in 2022. That’s a difference of 8,932 people.
  6. Iowa had negative migration of 1,856 people in 2023, versus a positive 1,872 people in 2022. That’s a difference of 3,728 people.

The net migration trends by state in 2023

Overall, most states remained in either positive or negative territory for migration.

That trend was on display over the last three years among the three most populous states of California, Florida and Texas.

Florida continued to gain people over the last three years, although it brought in 123,056 fewer people in 2023 than in 2022.

California kept losing people, but the exodus slowed by 73,814 people in 2023.

Texas also continued to gain people, but like Florida and most other states staying in positive territory, it brought in 40,889 fewer people in 2023.

Article Image

Sales of existing homes plunged in September, but prices did not

Despite falling mortgage rates during most of the month, sales of existing homes fell by a full percentage point in September, the worst showing in 14 years.

The National Association of Realtors reports three out of four major U.S. regions registered sales declines while the West experienced a sales bounce. Year-over-year, home sales were down 3.5%.

Total existing-home sales – completed transactions that include single-family homes, townhomes, condominiums and co-ops – fell to a seasonally adjusted annual rate of 3.84 million in September. 

“Home sales have been essentially stuck at around a four-million-unit pace for the past 12 months, but factors usually associated with higher home sales are developing,” said NAR Chief Economist Lawrence Yun. 

Waiting out the election?

“There are more inventory choices for consumers, lower mortgage rates than a year ago and continued job additions to the economy. Perhaps, some consumers are hesitating about moving forward with a major expenditure like purchasing a home before the upcoming election.”

The drop in home sales contributed to more inventory. The inventory of unsold existing homes rose by 1.5% from the prior month to 1.39 million at the end of September, or the equivalent of 4.3 months’ supply at the current monthly sales pace.

Even though there were significantly fewer buyers last month, the median home price rose, to $404,500, the 15th consecutive month of year-over-year price increases. That suggests most of the sales were of large, expensive homes. First-time buyers were responsible for only 26% of sales in September – matching the all-time low from August 2024 and November 2021.

All-cash sales totaled 30%, suggesting real estate investors remain active in the housing market.

A lot fewer bargains

“More inventory is certainly good news for home buyers as it gives consumers more properties to view before making a decision,” Yun said. “However, the inventory of distressed properties is minimal because the mortgage delinquency rate remains very low. Distressed property sales accounted for only 2% of all transactions in September.”

Distressed properties usually sell for a below-market price, giving first-time homebuyers and those on a budget more opportunities. While thousands of distressed properties were available after the 2008 housing market crash, they are more rare now.

There were fewer single-family home sales last month as that category fell by 0.6%. The median existing single-family home price was $409,000 in September, up 2.9% from September 2023.

Existing condominium and co-op sales dropped 5.1% in September to a seasonally adjusted annual rate of 370,000 units. That’s down 14% from one year ago. The median existing condo price was $361,600 in September, up 2.2% from the previous year.

Article Image

Study finds investors are a big reason for housing unaffordability

Home prices remain near an all-time high and there continues to be a shortage of available homes for sale. The fact that builders have reduced activity since the 2008 housing crash may be one reason.

However, a new study, co-authored by the Institute for Policy Studies and Popular Democracy, examines another possible reason. It suggests that real estate investors, from individuals to billion-dollar hedge funds, have removed many single-family homes from the market, converting them to rentals. The result, the study concludes, is there are fewer available homes and those that are available cost more than they should.

“Increased corporate control over our housing market — by billionaire investors and their for-profit entities — are driving these trends and placing significant barriers to the preservation and creation of permanently affordable housing,” the authors write.

The report points to an affordability crisis that stems from expensive houses and high interest rates. It says 22.4 million households — half of all renters — spend more than 30% or more of their income on rental housing. 

Housing as an investment

The study found that investors have bought up a huge share of single-family homes, apartment buildings, and mobile home parks to rent to already economically squeezed consumers. Housing has gone from being a basic need to becoming another investment.

“For instance, Blackstone is the largest corporate landlord in the world, with over 300,000 residential units across the United States,” the authors write. “Blackstone owns 149,000 multi-family apartment units, 63,000 single-family homes, 70 mobile home parks with 13,000 lots, and 144,300 beds of student housing in 205 properties. Blackstone also recently acquired 95,000 units of subsidized housing.”

While this may be a reason for unaffordable housing, there are other factors that may be limiting the expansion of the housing supply – particularly single-family homes. Since the building boom of the early 2000s, there have been a lot of changes.

Other reasons for unaffordable homes

For starters, inflation over the last 20 years has dramatically driven up the cost of construction. Land costs more too. Regulations are also tougher.

After decades of home construction, many of the prime home sites have already been developed in major metro areas. Zoning officials are turning down applications that don’t meet new, and tougher local standards. When builders do build, they go for luxury homes, outside of a first-time buyer’s budget.

But the study makes the case that there is plenty of housing stock. It claims that there are currently 16 million vacant homes, held by investors who are waiting for them to appreciate in value before selling them to other investors.

The study calls on federal, state and local lawmakers to enact stronger protections for low to moderate-income homebuyers, limiting investor access to the housing market.

Article Image

Mortgage rates are falling again

Just in time for the spring housing market, conditions for buyers are improving again. The Mortgage Bankers Association (MBA) reports mortgage rates fell last week after rising toward 8%. Not surprisingly, demand for mortgages increased.

“Mortgage rates dropped below 7% last week for most loan types because of incoming economic data showing a weaker service sector and a less robust job market, with an increase in the unemployment rate and downward revisions to job growth in prior months,” said Mike Fratantoni, MBA’s chief economist. 

Fratantoni said mortgage applications for home purchases increased 7.1% but that was still 11% below last year’s level. 

“By contrast, refinance volume picked up by 12%, with a larger, 24% increase in the government refinance index," he said. "While these percentage increases are large, the level of refinance activity remains quite low, and we expect that most of this activity reflects borrowers who took out a loan at or near the peak of rates in the past two years.”

The average rates

The average contract interest rate for 30-year fixed-rate mortgages with conforming loan balances ($766,550 or less) decreased to 6.84% from 7.02%, with points decreasing to 0.65 from 0.67 for 80% loan-to-value ratio (LTV) loans. The effective rate decreased from last week.

The average contract interest rate for 30-year fixed-rate mortgages with jumbo loan balances (greater than $766,550) decreased to 7.04% from 7.21%, with points increasing to 0.38 from 0.36 for 80% LTV loans.  

The average contract interest rate for 30-year fixed-rate mortgages backed by the FHA decreased to 6.77% from 6.86%, with points increasing to 0.95 from 0.90 for 80% LTV loans.

The average contract interest rate for 15-year fixed-rate mortgages decreased to 6.37 percent from 6.66 percent, with points increasing to 0.77 from 0.67 for 80% LTV loans. 

The average contract interest rate for 5/1 ARMs was unchanged at 6.38%, with points decreasing to 0.52 from 0.67 for 80% LTV loans. 

Article Image

Living alone? You’re probably paying the ‘singles tax.’

There’s a cost that comes from living by yourself in an apartment. There’s no one to share the rent or expenses.

Zillow, the online real estate marketplace, has calculated the extra financial cost faced by a single apartment dweller as the “singles tax.” According to Zillow, that “tax” has risen to $7,110 in 2024. In other words, that single apartment dweller could save that amount each year by having a roommate.

"While some renters may envy their coupled-up friends for dodging the singles tax, solo renters enjoy perks that go beyond financial savings. There's no arguing over which show to binge-watch next or disputes about whose turn it is to clean up after dinner," said Emily McDonald, Zillow’s  rental trends expert. "Still, it's crucial for renters to really dive into what living alone costs in their area and decide if the price tag is worth it."

Zillow's analysis also reveals that cohabitating renters across the country enjoy annual combined savings of $14,220 over their solo-dwelling counterparts. The savings are much greater in more expensive rental markets.

For example, roommates or couples in New York City are seeing potential savings of $40,200. That’s money that could be directed toward reducing debt or increasing savings.

Article Image

Which states have the most mortgage-free homeowners?

West Virginia, Mississippi, Arkansas, Louisiana and New Mexico. What do these five states have in common?

If you said they have the lowest income per capita in the U.S., you would be partially correct. Four of the five are in that category.

So it might be somewhat surprising that a new study from ConsumerAffairs found another common link among these five states: they have the largest percentage of mortgage-free homes in America. They have the largest percentage of homeowners who don’t make a monthly mortgage payment.

Owning your home free-and-clear is somewhat rare in the U.S., a status that usually isn’t achieved until later in life. Data from the National Association of Realtors (NAR) suggests that around 80% of buyers in the U.S. needed some kind of financing to purchase a home from July 2022 to June 2023. 

But in two states – West Virginia and Mississippi – slightly more than 50% of homeowners don’t have a mortgage.

Demographics

Jessica Lautz, NAR’s deputy chief economist and vice president of research, says demographics could be part of the explanation.

“This is likely a factor of home prices and how long the owner has been in the home,” said Lautz. “It is more likely that seniors who have been in their homes for longer periods would be mortgage-free. In areas like Colorado and Utah, which had pandemic-fueled housing booms, there may be more recent home buyers who have not yet had an opportunity to pay off their mortgage.”

In fact, about one-half of mortgage-free homeowners are 65 and older. Another factor is the recent trend of all-cash purchases, especially by people who sold houses in expensive states and moved to these states where prices are lower. 

“The U.S. still has tight housing inventory, and when there are multiple offers, the all-cash buyer is likely to win,” said Lautz. “In December of 2023, the share of all-cash buyers was 27% of home buyers.”

Article Image

Interest rates are falling but it may be harder to get a mortgage

The drop in mortgage rates to below 7% is good news for prospective homebuyers but unfortunately, there’s now a new challenge. It may be harder to qualify for a mortgage.

The Mortgage Bankers Association (MBA) reports mortgage availability decreased in December. That means there was less money to lend.

“Credit availability declined in December to the lowest level since 2012, as ongoing industry consolidation is resulting in more loan programs being removed from the marketplace,” said Joel Kan, MBA’s vice president and deputy chief economist. “Both conventional and government indices experienced decreases. The decrease in the government index was driven by lower investor demand for renovation loans and streamlined refinance loans.”

The Mortgage Credit Availability Index (MCAI) is the tool that tracks mortgage activity. In December, the index dropped 4.6% to 92.1. The index was benchmarked to 100 in March 2012.

Bottom line, a declining MCAI means lenders have tightened their standards, demanding larger down payments and higher credit scores. Buyers might have to shop around more to find a mortgage lender they can work with. 

If you’re looking for a mortgage lender, this ConsumerAffairs tool might help.

While credit availability was down across the board, it was down most in government lending programs, such as FHA loans. Conventional loan availability declined only half as much.

Article Image

Moving? Here are the best metros for first-time homebuyers.

Housing experts are largely in agreement when it comes to 2024’s homebuying opportunities. They should be better than last year’s.

The experts ConsumerAffairs consulted this week predict interest rates could fall below 6% in the months ahead.

So if you’ve been waiting patiently for an opportunity to buy your first home, 2024 may be your year. But if your job allows you to work remotely and you’re willing to relocate, the opportunities may be even greater.

A recent ConsumerAffairs study identified the best cities for first-time buyers. While home prices were a key component, the study also considered quality-of-life factors. Each metro received a financial friendliness score and a quality-of-life score, which were added together for an overall score.

The quality-of-life score components include crime rates, unemployment rate, climate and racial diversity.

The top 10

Based on those factors, here are the 10 best metros for first-time homebuyers:

  1. Raleigh-Cary, N.C.

  2. Provo-Orem, Utah

  3. Naples-Marco Island, Fla.

  4. Oxnard-Thousand Oaks-Ventura, Calif.

  5. Cape Coral-Ft. Myers, Fla.

  6. San Diego-Chula Vista-Carlsbad, Calif.

  7. Port St. Lucie, Fla.

  8. Barnstable, Mass.

  9. Boise, Idaho

  10. Bridgeport-Stamford, Conn.

What makes Raleigh so special? It’s the largest city in the “Research Triangle” of North Carolina, which gets its name from the biggest research park in the U.S. — covering 7,000 acres, where over 50,000 people work at companies including IBM and Cisco.

The Raleigh-Cary area has the fifth-highest financial friendliness score of all metro areas, and it ranks 14th in having the least violent crime.

In addition to comparative affordability and safety, Raleigh-Cary residents benefit from the area’s exceptional greenway system, diverse arts scene, free museums — the “Smithsonian of the South” — and temperate climate.

Madison, Wisc., Knoxville, Tenn., and Elizabethtown, Ky., also rank as markets that are friendly to first-time buyers. Check out the full study here.