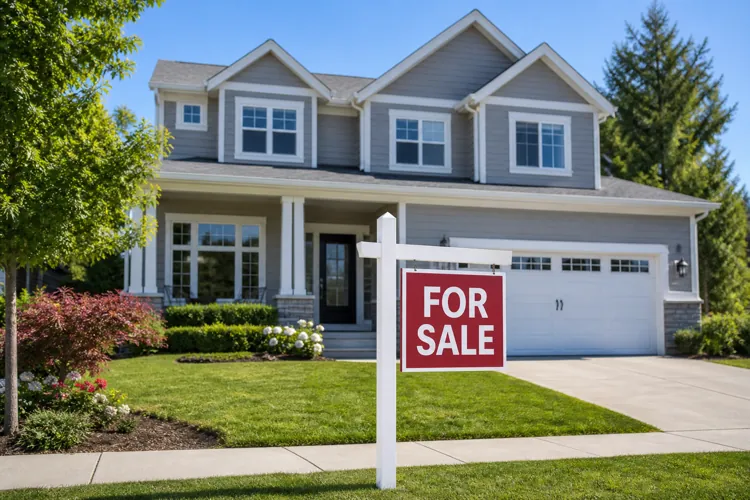

The national median home listing price fell 2.4% from a year earlier to $428,950 in July.
Sellers reduced the asking price on 20% of listings as the summer housing market lost momentum.
Pending sales increased for the eighth straight month, suggesting buyers remain active despite high borrowing costs.
Home sellers are becoming more willing to lower their asking prices as the summer buying season cools, but buyers have not entirely retreated from the market.
According to Realtor.com’s July Housing Market report, the national median listing price was $428,950 in July, down 2.4% from a year earlier and nearly unchanged from June. It was the ninth consecutive month in which asking prices declined on an annual basis.
Price reductions also became more common. Sellers cut the asking price on 20% of active listings, up from 18.8% in June and just below the 20.6% recorded in July 2025.
The figures indicate that some sellers may have initially priced their homes higher than buyers were willing or able to pay. Elevated mortgage rates continue to limit purchasing power, forcing buyers to be more selective.
“July’s data show a market that is cooling seasonally, not coming apart,” Realtor.com Chief Economist Danielle Hale said in the report. She said sellers are adjusting their prices while buyers are responding more selectively.
Buyers are still signing contracts
Despite the increase in price cuts, the number of listings in pending status rose 1.3% from July 2025. That marked the eighth consecutive month of annual pending-sales growth, the longest such stretch since 2020 and 2021.
However, the pace of growth is slowing. Pending listings increased 4.1% in May and 3.7% in June before easing to 1.3% in July.
Homes spent a median of 57 days on the market, four days longer than in June but one day less than a year earlier. It was the first annual decrease in selling time following 26 consecutive months in which homes took longer to sell than they did the previous year.
July’s 57-day selling period was also in line with the typical July pace before the pandemic.
Regional differences remain significant
Price trends varied widely depending on location.
Median listing prices fell 3.9% from a year earlier in the West and 2.5% in the South. Prices declined 1.4% in the Northeast but edged up 0.2% in the Midwest.
Price per square foot, which helps account for differences in the size of homes being listed, declined in 34 of the 50 largest metropolitan areas. Austin, Texas, recorded the largest annual decrease at 8.5%, followed by Memphis at 6% and Tampa at 4.8%.
Providence, Rhode Island, posted the largest increase in price per square foot at 8.3%. Indianapolis was up 4.8%, while Hartford, Connecticut, increased 4.5%.
Price reductions were most common in Portland, Oregon, where 31% of listings had been marked down. Denver followed at 30.9%, while Dallas and Austin were both at 28.3%.
At the other end of the scale, only 9% of Hartford listings had a price reduction. New York was next at 9.7%, followed by Buffalo at 10.5%.