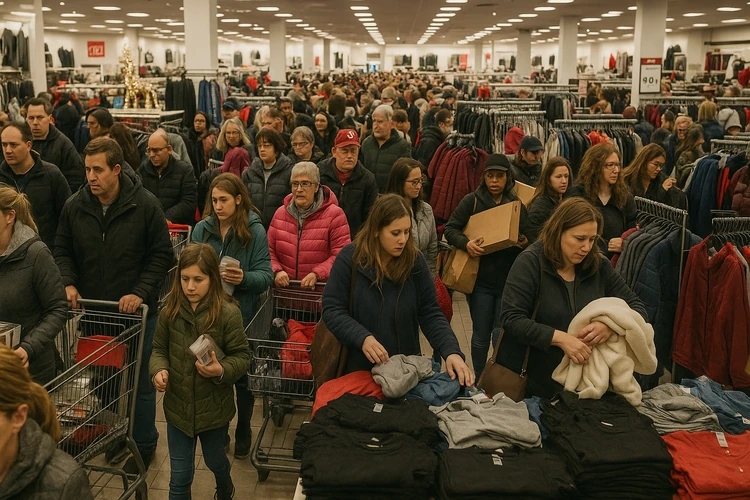
People who are worried that the economy is headed into a recession have received some encouraging news. The Labor Department reports that the U.S. economy added 528,000 jobs in July, dropping the unemployment rate to 3.5%. Normally in a recession, the economy sheds jobs.
According to the government report, job growth was widespread across the economy. The sectors of leisure and hospitality, professional and business services, and health care saw the biggest gains. Government economists say the employment picture has now returned to the way it was just before the start of the COVID-19 pandemic.
The number of long-term unemployed – those out of work for 27 weeks or more – decreased by 269,000 in July to 1.1 million, which was what it was just before the start of the pandemic. The long-term unemployed accounted for 18.9% of those who were out of work in July.
The labor force participation rate, at 62.1%, and the employment-population ratio, at 60.0%, were little changed over the month. Both measures remain below their February 2020, levels.
Restaurants were finally able to staff up
Leisure and hospitality added 96,000 jobs in July, as growth continued in food services and drinking places. However, employers in this sector continue to struggle to find workers. Employment in leisure and hospitality is below its February 2020, level by 1.2 million, or 7.1%.
There was also a lot of hiring last month in the professional and business services sector, which added 89,000 jobs. The new hires were widespread within the industry, including gains in the management of companies and enterprises, architectural and engineering services, management and technical consulting services, and scientific research and development services. Employment in this sector is 986,000 higher than in February 2020.
After struggling to fill open slots in early 2022, the health care sector saw strong job growth, adding 70,000 jobs in July. Job gains occurred in ambulatory health care services, hospitals, and nursing and residential care facilities. However, jobs in health care remain below their pre-pandemic levels.
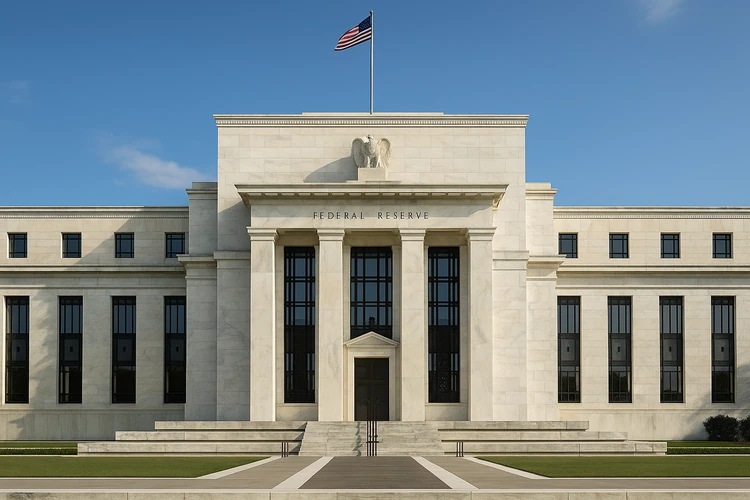
The Fed is likely to keep raising rates
While the numbers are good news for people looking for jobs, the Federal Reserve may look at it differently. Its policy of raising a key interest rate is aimed at slowing the economy to tamp down inflation.
The July jobs report suggests that the economy isn’t slowing that much, meaning the Fed is unlikely to take its foot off the brake anytime soon. As for inflation, the government will shed some light on that problem when it issues the Consumer Price Index (CPI) for July last week.
The CPI, a measure of inflation, was increasing at a 9% annual rate in June, the highest increase rate since 1982.