Cities With the Worst Drivers in America (2026)

+1 more

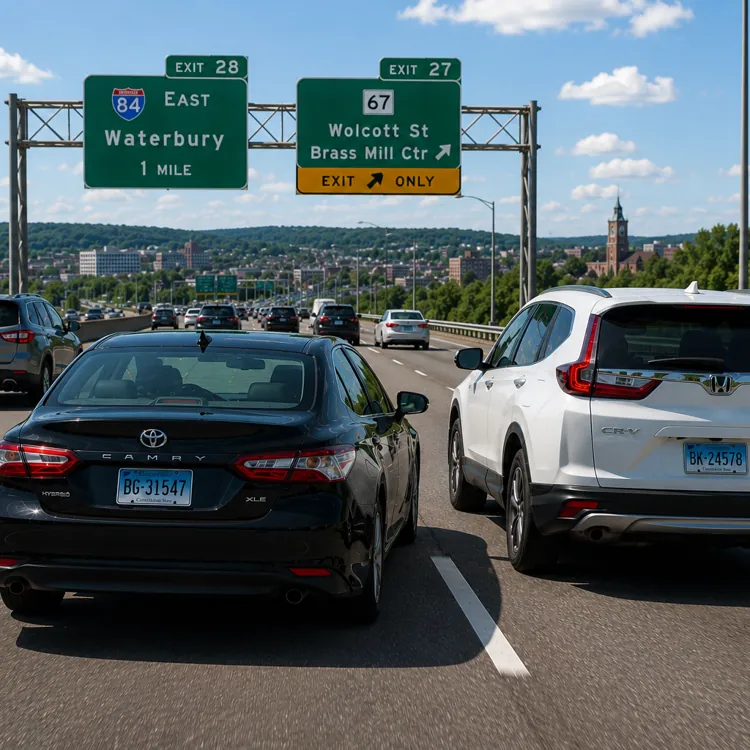
You can drive defensively, stay off your phone and even invest in a good extended car warranty to keep your vehicle in good working order. But none of that guarantees the driver next to you is doing the same. One reckless decision can turn an ordinary commute into a tragedy.
The National Highway Traffic Safety Administration (NHTSA) recorded 39,254 traffic deaths nationwide in 2024 (the latest year for which complete data is available). That’s a slight improvement over the year before, but where you drive still matters: Drivers in some cities are more likely to put others at risk.
So, where are things getting worse, and where are they improving? For the fourth year in a row, the ConsumerAffairs Research Team analyzed the latest NHTSA crash data across five factors related to fatal accidents and deaths. Read on to find out if your city made the list.
Key insights
Waterbury, Connecticut, has the worst drivers in the U.S. It’s the only Northeastern city among the 45 worst-ranked cities.
Jump to insightMemphis, Tennessee, is no longer home to the nation’s worst drivers, ending a three-year streak at No. 1. It fell to No. 2 in 2026.
Jump to insightFive of the 10 cities with the worst drivers are in the South: Memphis; Baton Rouge, Louisiana; North Charleston, South Carolina; Odessa, Texas; and Knoxville, Tennessee.
Jump to insightCharleston, South Carolina, saw one of the largest improvements this year, dropping from No. 10 in 2025 to No. 217 in 2026.
Jump to insightSalinas, California, has the lowest rate of deadly driving in the U.S., with 0.6 traffic fatalities per 100,000 residents.
Jump to insightWhich cities have the worst drivers in the U.S.?
Southern cities still dominate this year’s rankings, claiming five of the 10 worst spots for dangerous driving. But zoom out to the 25 worst-ranked cities overall, and the West actually edges out the South, 11 cities to 10. That’s a shift from the clear Southern lead seen in past years.
Part of that shift comes from a cluster of Southern California suburbs going in the wrong direction. Rialto, Jurupa Valley and Hesperia all appear in this year’s worst-ranked list. All three sit in the same metro area outside Los Angeles and moved up from last year by dozens of spots.
Clusters like that raise a question: Why do some regions consistently produce more dangerous cities than others?
“Rather than one single cause, traffic fatalities and serious injuries usually result from a combination of road design, travel patterns, driving behavior and public investment,” said Pei-Sung Lin, director of the Intelligent Transportation Systems, Traffic Operations and Safety Program at the University of South Florida’s Center for Urban Transportation Research. “Regions that consistently rank higher often face several of these challenges at the same time, making crashes more frequent and more severe.”
See the map below for a visual breakdown of the 50 worst cities, then scroll down for a closer look at the leaders.

1. Waterbury, Connecticut
Waterbury takes the top spot for the first time, capping a three-year climb from 134th in 2023 to first in 2026.
The city, about 90 miles northeast of New York, is the only one to rank No. 1 in two different metrics we studied. It has the highest number of deaths involving DUIs in the country, at 9.5 per 100,000 residents. It also has the highest rate of fatalities involving a positive blood alcohol content (BAC) reading, at 8.7 per 100,000 residents.
Waterbury is also the only Northeastern city among the 45 worst-ranked. The next closest is another Connecticut location, Hartford, which ranks 46th.
Local efforts are underway to improve road safety. Waterbury is part of a regional safety effort called NVision Zero. It aims to eliminate serious and fatal crashes by 2060 and includes strategies such as improving street design and promoting safe travel behaviors.
2. Memphis, Tennessee
Memphis loses the top spot after three straight years as the city with the worst drivers. The number of traffic deaths per 100,000 people fell 21% from last year, but it’s still high enough to be second most in the U.S. Memphis still leads the nation in fatal crashes tied to bad driving behaviors, at 14.3 per 100,000 residents.
Memphis has completed a safety action plan that meets requirements of the federal Safe Streets and Roads for All program, aimed at reducing roadway deaths and serious injuries citywide. The decline in this year’s numbers suggests those efforts may be working.
Pedestrians should also be wary of Memphis’ drivers: It ranks second most dangerous in our latest pedestrian safety report, while the nonprofit Smart Growth America ranks it as the most dangerous metro area in the country for pedestrians.
3. Baton Rouge, Louisiana
Baton Rouge went up 29 spots this year, from 32nd to third worst. Its ranking hasn’t steadily gotten worse like Waterbury’s. Instead, it’s been all over the place these past four years: second worst in 2023, eighth in 2024, 32nd in 2025 and now back near the top again.
Alcohol is the common thread behind the jump. Baton Rouge has the second-highest rate of fatalities involving a positive BAC reading in the country, at 7.7 per 100,000 residents. It also has the third-highest DUI fatality rate, at 6.3 per 100,000.
4. North Charleston, South Carolina
North Charleston has steadily climbed over four years, from 36th in 2023 to fourth this year. Unlike the top three cities, alcohol isn’t the main driver here. Speeding is. North Charleston has the second-highest rate of speeding-related fatalities in the country, at 11.1 per 100,000 residents, up nearly 160% from last year.
If there’s a bright spot, it’s that in three of the five metrics we examined, North Charleston has improved from last year’s analysis. That includes the rate of traffic deaths, which is down 4%. And according to the state’s Department of Public Safety, traffic deaths statewide fell 21% from 2021 to 2025.
5. Odessa, Texas
Odessa ranked 18th for worst drivers the past two years, but rises to fifth in 2026. It ranks in the top 10 nationally across three categories:
- Fatalities involving a positive BAC reading
- Speeding-related deaths
- Crashes tied to bad driving
The rate of speeding-related deaths in Odessa rose 74% year over year, one of the reasons for this year’s jump. And the rate of traffic deaths increased 45%.
6. Knoxville, Tennessee
Knoxville’s deadly driving metrics improved this year, led by a 24% drop in deadly crashes involving bad driving and a 19% decrease in fatal crashes tied to speeding. But the city only moved down four spots, from second to sixth.
That’s because Knoxville’s rates remain among the worst in the country. It still has the second-highest rate of fatal crashes involving bad driving (10.5 per 100,000 residents), and the third-highest overall fatality rate (27.1 per 100,000).
Knoxville is pushing for improvement. The city reopened its Neighborhood Traffic Safety Program this past January, so residents can request that the city create conditions for slower traffic on residential streets, primarily by installing speed humps. It’s one piece of the city’s bigger goal to eliminate traffic deaths by 2040.
7. Rialto, California
Rialto made the biggest wrong-way turn of any city in this year’s top 10, changing 155 spots, from 162nd to seventh.
In every measure, Rialto got worse year over year. The steepest increase was alcohol-related. Deaths involving positive BAC readings went from zero to 3.8 per 100,000 residents, while fatalities involving driving under the influence rose 293%. That tracks with a wider trend in the region. A 2025 California State University, San Bernardino study found alcohol-impaired driving deaths across the Inland Empire were well above the average statewide.
8. Jurupa Valley, California
Jurupa Valley’s change in ranking is one of the most dramatic in this year’s report. The city ranked 314th, near the bottom of the list, two years ago. Last year it was 49th.
Speeding-related deaths are to blame. The rate, 12.1 per 100,000 residents, is up more than 327% from last year, and is the highest in the country. In smaller cities — Jurupa Valley ranks 299th in population out of 338 cities in our study — “even a relatively slight increase in serious crashes can make the numbers appear to spike,” Lin, of USF, said.
9. Kansas City, Missouri
Kansas City’s ranking has bounced around over the past four years, from 34th worst in 2023 to 245th in 2024, then back up to sixth in 2025. This year, it settled at ninth, with improvements in every metric.
Even so, Kansas City has the fourth-highest rate of speeding-related fatalities in the country, at 10.3 per 100,000 residents, and the rate of deaths involving positive BAC readings, 6.2 per 100,000, is ninth highest.
More recent figures point to a possible turnaround. Kansas City Public Radio reported that traffic deaths fell 30% from 2024 to 2025 — but the city’s Vision Zero strategy still has a long way to go to accomplish its goal of eliminating traffic deaths and serious injuries by 2030.
10. Hesperia, California
Hesperia rounds out this year’s top 10, moving up 78 spots from last year. Its overall fatality rate rose more than any other top 10 city this year, up 47%, to 26.4 per 100,000 residents, the fourth highest in the country. It also has the seventh-highest rate of traffic deaths involving driving under the influence and the seventh highest-rate of deaths involving speeding.
Rapid population growth may be a factor in the rise of dangerous driving. Hesperia’s police department has cited the city’s rapid increase in population over the past five years as a contributor to its traffic safety challenges.
How does dangerous driving compare across U.S. cities?
Across the full dataset, population size seems to matter when it comes to big swings in metrics. Cedar Rapids, Iowa, with one of the smaller population sizes on our list, exemplifies this well. The count of traffic deaths fell from 17 to four over a year; that contributed to an improvement of 274 spots in the overall rankings — the greatest of any city in the U.S.
That pattern may help explain one of the odder findings in this year’s data. Charleston, South Carolina, fell 207 spots, from 10th worst to 217th. Its neighbor, North Charleston, climbed to fourth from 13th over the same stretch — two smaller cities in the same metro area, moving in opposite directions.
The same volatility applies at the other extreme. El Cajon, California, posted the largest move toward the dangerous end of the rankings in the country, from 305th to 45th. Colorado stands out, too. Fort Collins, Greeley and Thornton all took a wrong turn by at least 148 spots. (Colorado also ranks among the worst for road rage.)
Of all 338 cities in our analysis, Salinas, California, performed best overall: It had just one traffic-related death in the latest year that data is available — and it wasn’t attributable to bad driving, alcohol, drugs or speeding.
See the full dataset below to learn how every city compares.
Tips for protecting yourself against bad drivers
Defensive driving won’t stop other people from driving recklessly, but it can help you avoid becoming part of the consequences.
Here’s what road safety experts recommend:
- Keep a conservative following distance. “Think in seconds, not car lengths,” said Nicholas Burlingame, a region director at Sage Truck Driving Schools, which trains commercial drivers. “Pick a fixed point on the road and count how long it takes you to reach it after the car ahead passes it.” He recommends three to five seconds in good conditions, and more if the driver ahead seems distracted.
- Put your phone away before you drive. Doug Herbert, the founder of B.R.A.K.E.S., a nonprofit that trains teenage drivers, noted that distracted driving is the top issue his instructors see, even with hands-free laws in place.
- Scan around, not just straight ahead. Herbert recommends adjusting your mirrors and seat first, so you have “an unimpeded 360-degree view” around you.
- Don’t engage with aggressive drivers. “The moment you try to teach someone else a lesson on the road, you’ve become part of the problem,” Burlingame emphasized. Slow down and let them pass instead.
Methodology
To determine the cities with the worst drivers, the ConsumerAffairs Research Team analyzed the most recently available crash data from the National Highway Traffic Safety Administration's (NHTSA) Fatality Analysis Reporting System (FARS).
We included only cities with populations of 100,000 or greater. A total of 338 cities met this threshold in 2026. Because eligibility is based on population, the list of qualifying cities can change slightly from year to year as populations grow or decline.
We evaluated each city across five crash factors:
- Traffic fatalities per 100,000 residents
- Fatal crashes related to bad driving per 100,000 residents
- Traffic fatalities involving positive blood alcohol content (BAC) readings per 100,000 residents
- Traffic fatalities involving driving under the influence (DUI) per 100,000 residents
- Traffic fatalities involving speeding per 100,000 residents
Each city received a score from zero to 20 for each factor, with the city recording the highest rate receiving 20 points, and all other cities scored proportionally. We then summed the five factor scores to create a crash score ranging from zero to 100.
Fatal crashes related to bad driving included those involving:
- Aggressive driving
- Careless driving
- Driving the wrong way on a one-way traffic way
- Failure to yield the right of way
- Following improperly
- Improper or erratic lane changing
- Making an improper turn
- Operating the vehicle in an erratic, reckless or negligent manner
- Operator inexperience
- Passing where prohibited
Reference policy
We love it when people share our findings! If you do, please link back to our original article to credit our research.
Questions?
For questions about the data or if you'd like to set up an interview, please contact jrodriguez@consumeraffairs.com.
Article Sources
ConsumerAffairs writers primarily rely on government data, industry experts and original research from other reputable publications to inform their work. Specific sources for this article include:
- National Highway Traffic Safety Administration, “NHTSA File Downloads.” Accessed July 17, 2026.
- U.S. Census Bureau, “City and Town Population Totals: 2020-2025.” Accessed July 17, 2026.
- National Highway Traffic Safety Administration, “Overview of Motor Vehicle Traffic Crashes In 2024.” Accessed July 17, 2026.
- Naugatuck Valley Council of Governments, “Transportation Safety Program – NVision Zero.” Accessed July 17, 2026.
- Memphis Safety Action Plan, “Safe Streets and Roads for All.” Accessed July 17, 2026.
- Smart Growth America, “Dangerous by Design.” Accessed July 17, 2026.
- South Carolina Department of Public Safety, “SCDOT, SCDPS Highlight Progress and Announce Continued Efforts to Improve Roadway Safety in South Carolina.” Accessed July 17, 2026.
- City of Knoxville, “Vision Zero.” Accessed July 17, 2026.
- City of Knoxville, “Updated Neighborhood Traffic Safety Program Opens Jan. 1.” Accessed July 17, 2026.
- CSUSB ScholarWorks, “Urban-Rural Dynamics and DUI Fatalities in the Inland Empire: A Neural Network Analysis of Traffic Safety Disparities.” Accessed July 17, 2026.
- Kansas City Public Radio, “Kansas City saw traffic deaths drop by 30% in 2025. Its effort to make roads safer is working.” Accessed July 17, 2026.
- City of Kansas City, “Vision Zero & Mobility.” Accessed July 17, 2026.
- City of Hesperia, “Traffic Unit.” Accessed July 17, 2026.
- National Highway Traffic Safety Administration, “10 Safe Driving Tips for 2026.” Accessed July 17, 2026.
- AAA, “Aggressive Driving.” Accessed July 17, 2026.
Figures