Population Over 65 by State
+3 more

The senior population in the U.S. has grown as the baby-boom generation has progressed into the 65 years and older age group. In 2023, there were 59,307,056 Americans over the age of 65. This is a 33.05% increase since 2013, which had approximately 44,574,166 Americans over 65. By the year 2030, it is estimated that the 65 plus population could represent 20.6% of the total U.S. population.
Approximately 59.3 million people in the United States are over 65, representing a 9.4% growth since 2020.
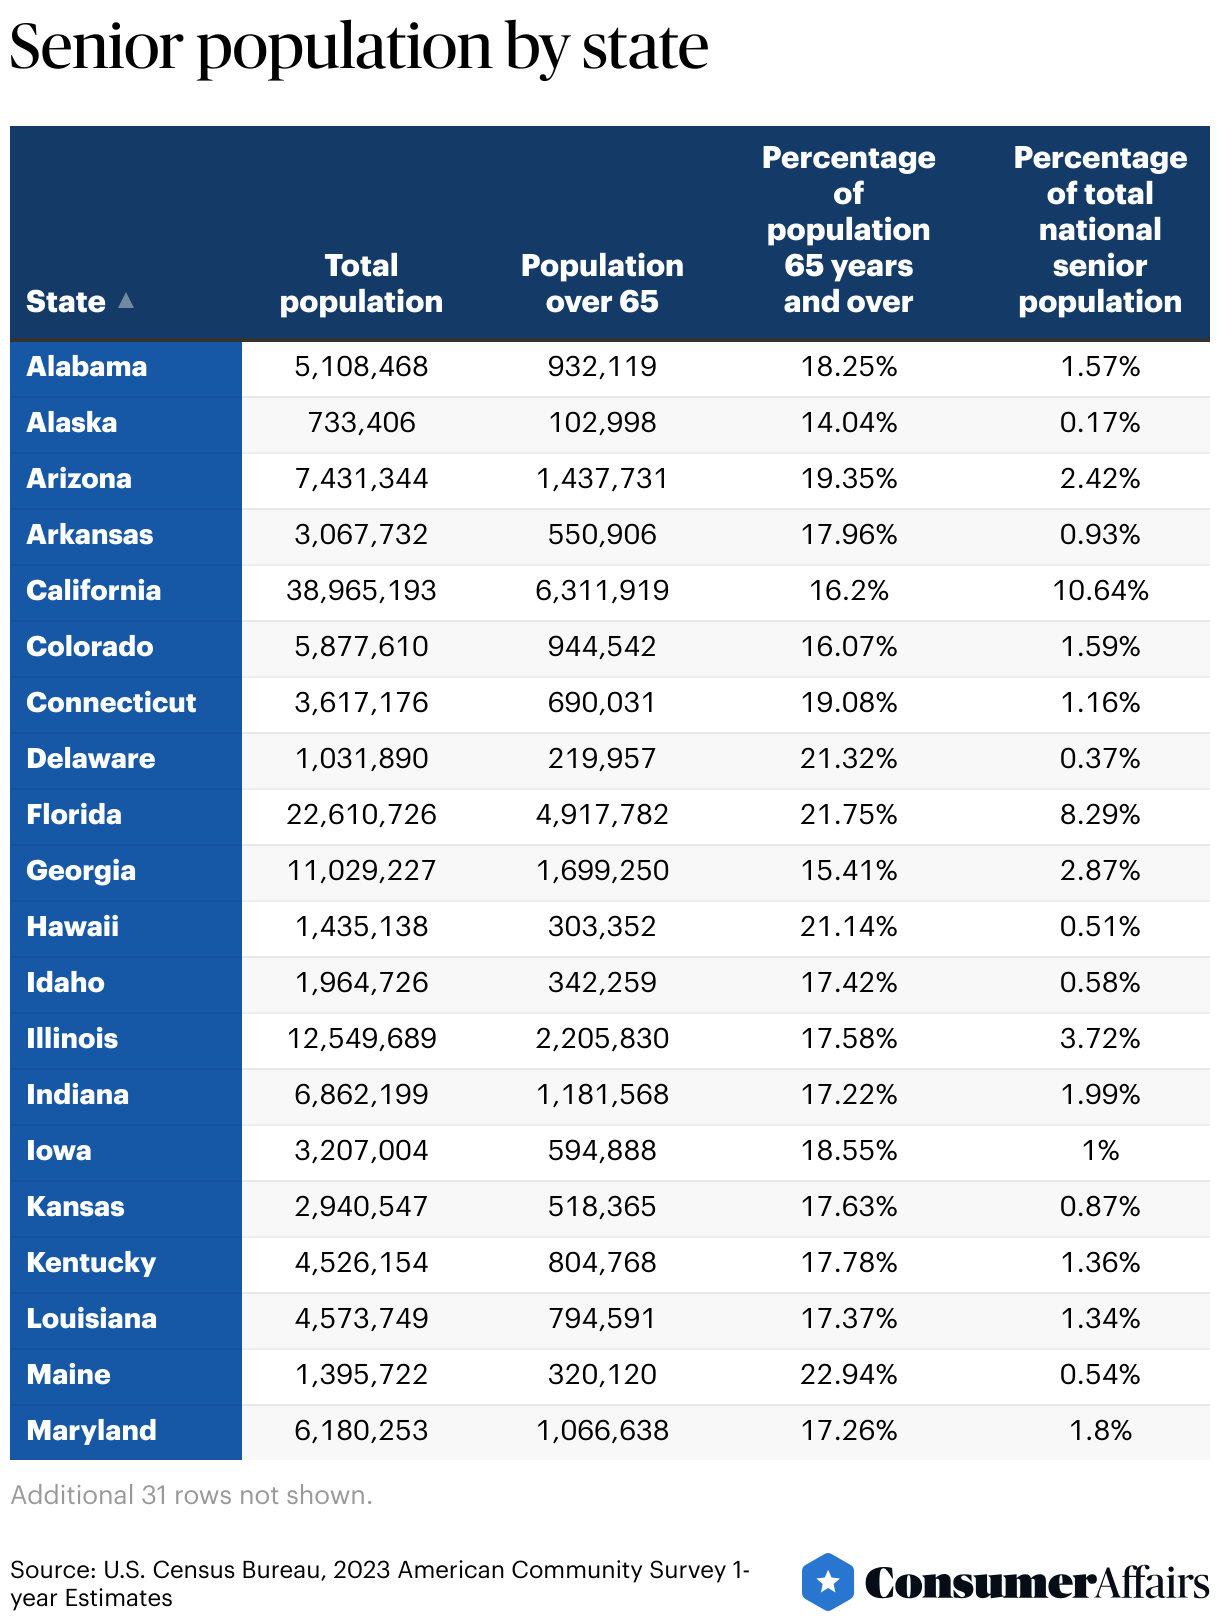
Jump to insightOnly nine states in the U.S. have over 20% representation of people over 65. The most represented state is Maine, with 22.94% of its population over 65, followed by Vermont (22.15%) and Florida (21.75%).
Jump to insightThe three states with the lowest percentage of seniors include Utah (12.16%), Texas (13.75%) and Alaska (14.04%).
Jump to insightCalifornia is home to the largest population of seniors (over 6.3 million), while Alaska has the lowest senior population (roughly 103,000).
Jump to insightRatio of senior population by state
Maine (22.94%), Vermont (22.15%) and Florida (21.75%) are among the states with the highest percentage of residents ages 65 and older. Conversely, the states with the lowest concentration of senior population include Utah (12.16%), Texas (13.75%) and Alaska (14.04%).
Senior population by state
We analyzed each state’s total population, senior population (ages 65 and older), the percentage of seniors within each state’s population and the share of the national senior population represented by each state.
Maine
While Maine's total senior population is only a little over 300,000, the state has the highest concentration of senior residents (22.94%) among all U.S. states. In recent years, the proportion of young people in Maine has declined more rapidly than in other New England states. Additionally, most counties in Maine have experienced relatively slow rates of growth. This has led to a constrained workforce in the state, coupled with an increasing need for health services.
Maine’s Department of Health and Human Services estimates 28% of Mainers will be 65 years old or older by 2030.
Florida
Florida is home to so many older residents partially because of its abundance of retirement communities in walkable cities, warm weather and lack of estate taxes. Among the top ten cities with the highest percentage of seniors in 2020, six were located in Florida. They include Cape Coral, Clearwater, Hialeah, Lakeland, Port St. Lucie and Pompano Beach. In terms of population, Florida represents the 2nd largest population of seniors. As of 2023, there were 4,917,782 residents over 65 in Florida.
According to the State of Florida Department of Elder Affairs, it is estimated that by 2045, more than 30% of the state’s population will be ages 60 and older.
Elderly population by state
Over a quarter of seniors in the U.S. live in California, Florida or Texas. California is the state with the highest total senior population, reaching over 6 million seniors. As of 2023, the population over 65 in California was 6,311,919. Alaska, on the other hand, is the state with the smallest elderly population, with 102,998 residents 65 and older.
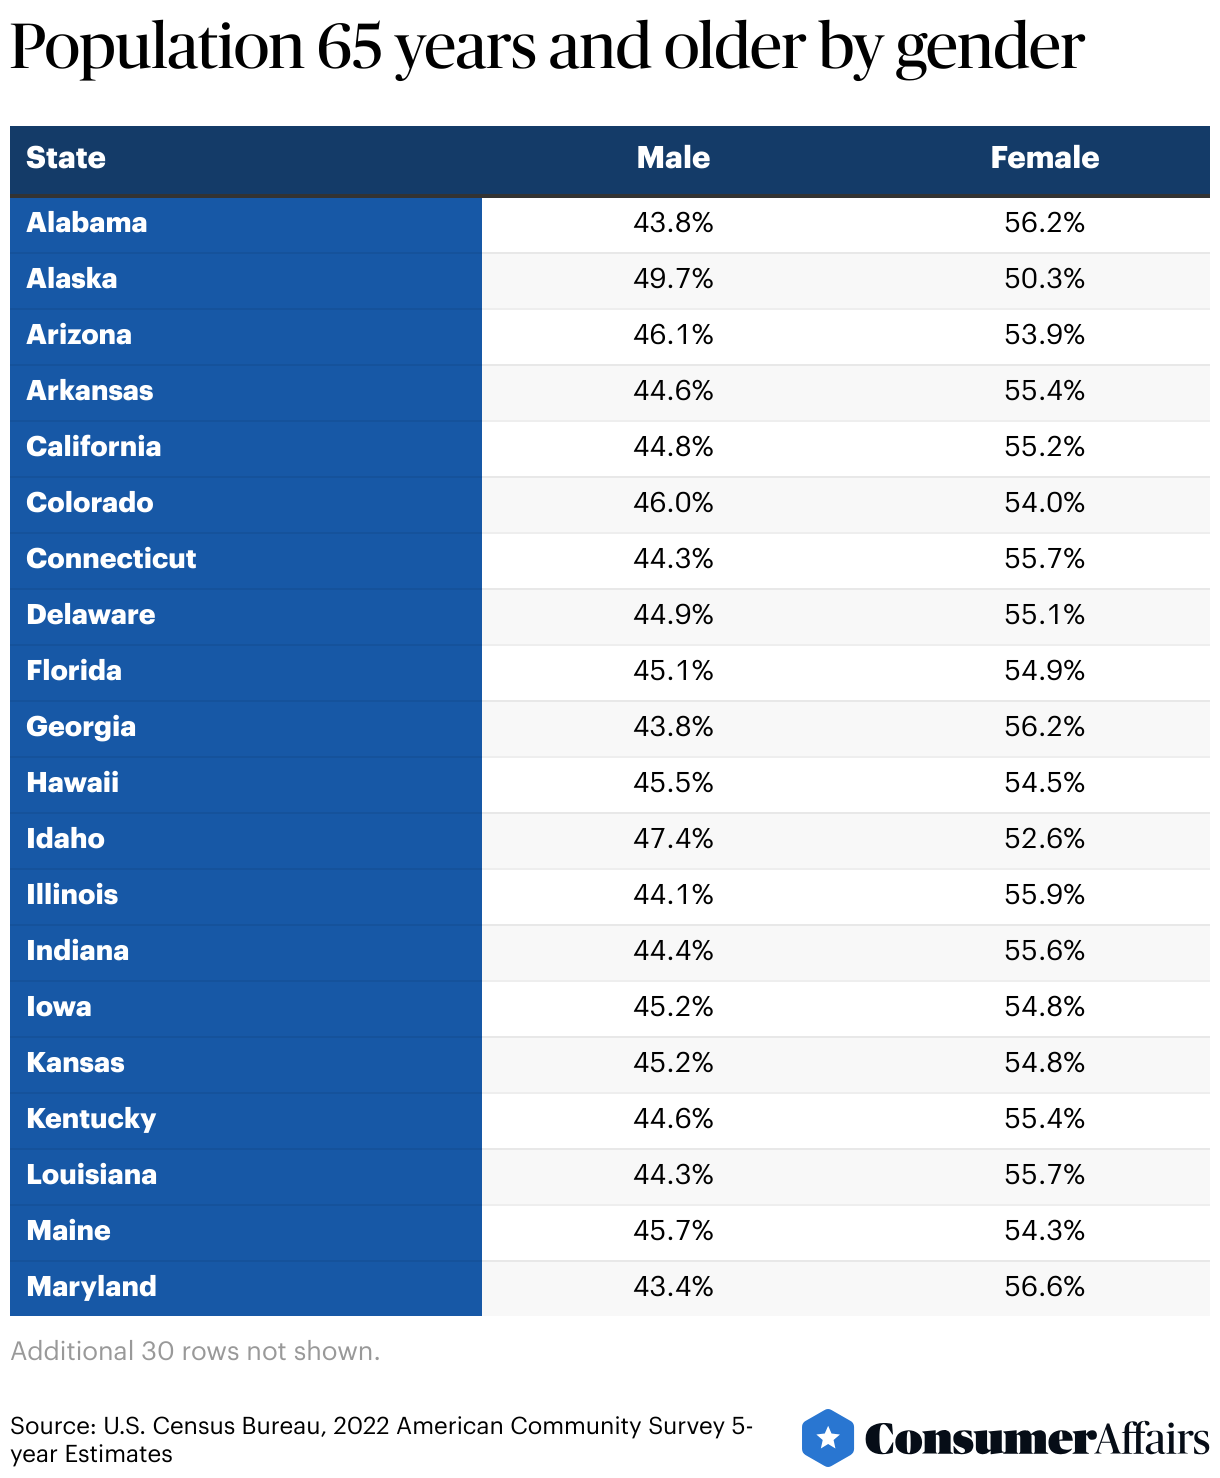
Population 65 years and over demographics U.S.
Overall, women make up a larger percentage of the population over 65 in the United States. Maryland and Georgia have the largest population percentage differences with Maryland having a 12.2% difference (56.1% women and 43.9% men) and Georgia with a 11.8% difference (55.9% women and 44.1% men). The state with the smallest population difference between men and women is Alaska, with 50.7% women and 49.3% men in the population.
Population 65 years and older by gender
We examined the distribution of the senior population by gender across all states, highlighting the percentage of men and women ages 65 and older within each.
Population 65 years and older by race
Below is the racial composition of the senior population which details the percentage of individuals 65 and older by race in each state.
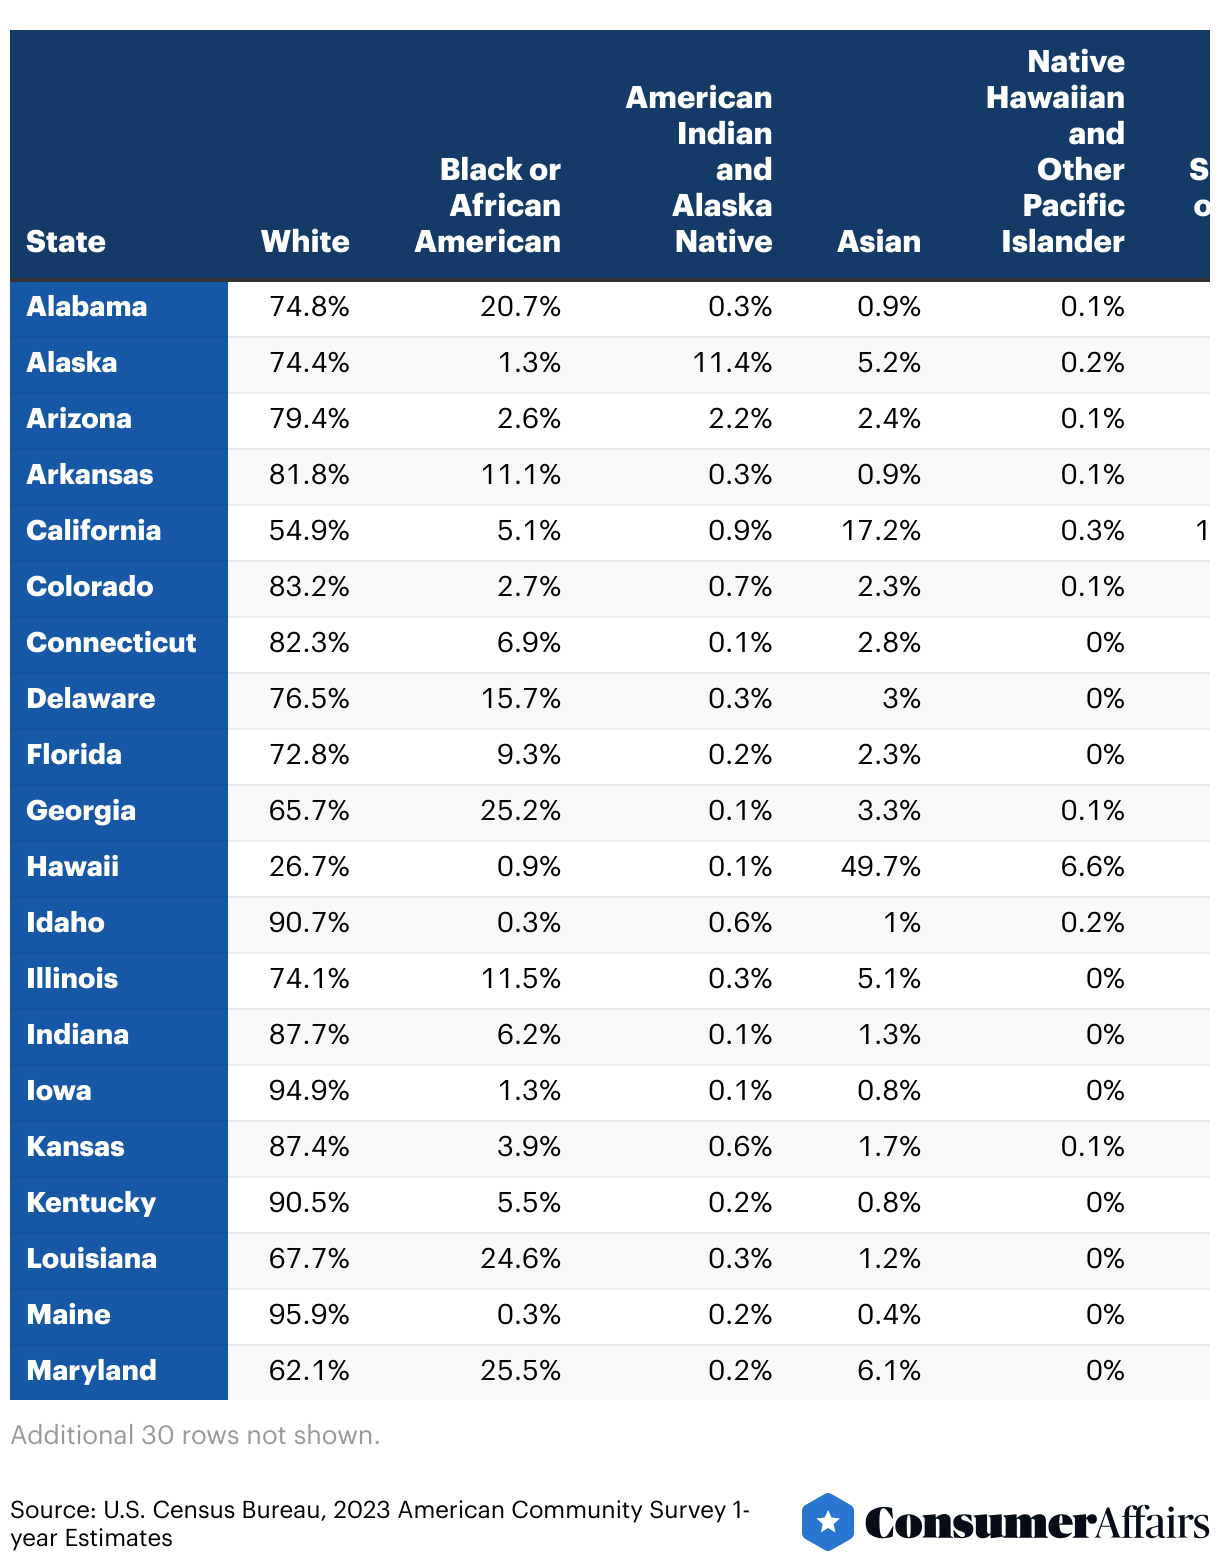
The following statistics highlight states with the highest and lowest percentages of seniors who self-identify as belonging to "one race":
- Maine is the state with the largest percentage of senior white population (95.9%), while Hawaii is the state with the lowest percentage (26.7%).
- Mississippi has the highest percentage of Black or African American senior population (28.5%), and Montana has the smallest (0.1%).
- In Alaska, approximately 11.4% of seniors self-identify as American Indian or Alaska Native, a significantly higher percentage compared to most other states where they comprise less than 1% of the senior population.
- In Hawaii, Asians make up 49.7% of the elderly population, which is a stark contrast to states like West Virginia, where only 0.3% of the senior population is Asian.
It is important to note the U.S. Census makes a clear distinction between the concept of race and the concept of origin. Individuals identifying their origin as Hispanic, Latino or Spanish can be classified among any racial group.
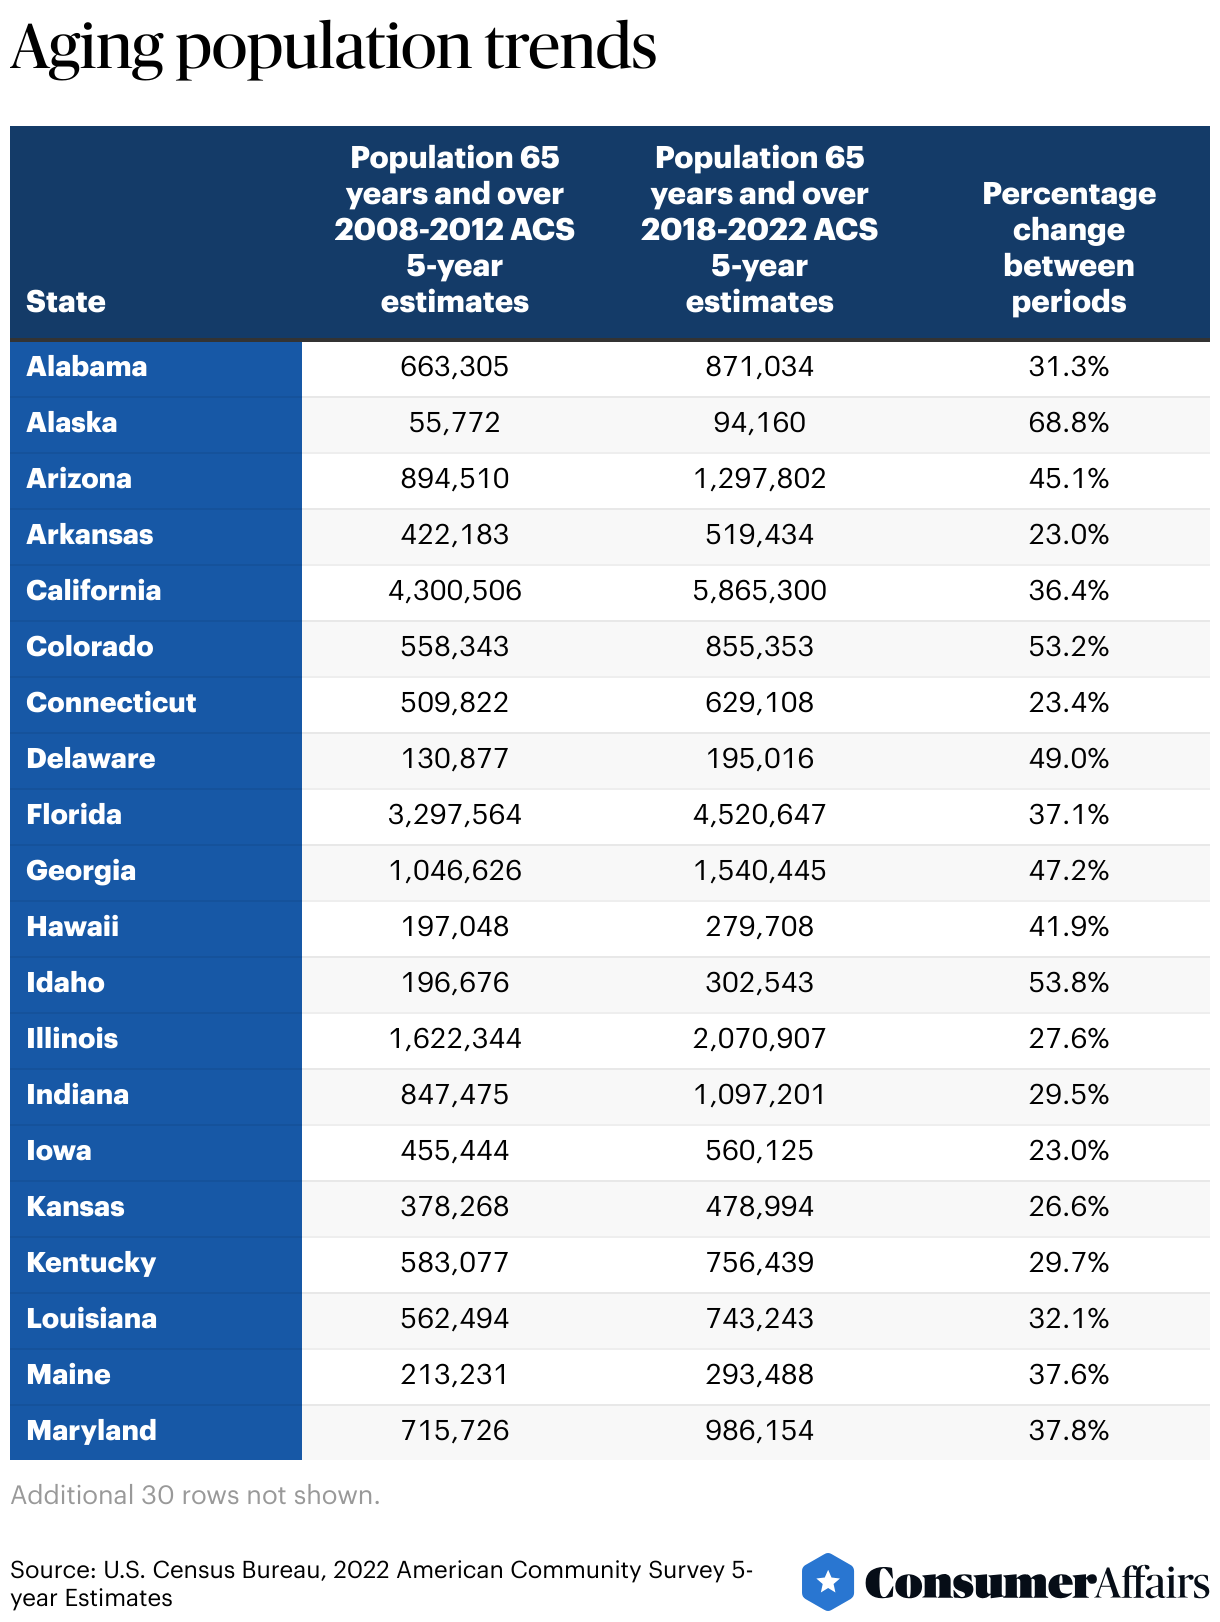
Aging population trends
Since 1900, the decade from 2010 to 2020 witnessed the most significant growth in the older demographic in terms of absolute numbers, percentage of the total population and growth rate.
As baby boomers age, state populations are seeing an increase in residents 65 years and over. In the last 10-year period, the states experiencing a change in senior population of at least 50% include Alaska (65.7%), Colorado (50.8%), Idaho (53.7%) and Nevada (51.4%). The three states with the lowest increase in elderly population in the same period are Arkansas (21.8%), West Virginia (21%) and Oklahoma (23.1%). The calculations are based on American Community Survey 5-year Estimates for the periods 2009-2013 and 2019-2023.
Aging population predictions
- It is projected that by 2050, the population of Americans aged 65 and older will reach 82 million, accounting for 23% of the total U.S. population.
- Estimates show that by 2050, the proportion of seniors identifying as non-Hispanic white is expected to be 60%, marking a considerable decrease from the 75% recorded in 2020.
- By 2030, projections indicate that in 26 states, at least 20% of the population will be 65 years or older.
Possible problems
States with larger aging populations may face future issues, including a surplus of homes for sale, a shortage of workers for both assisted living facilities and the general job market, declining economic growth and strain on their welfare and health care systems.
Increased desire to “age in place”
A recent study from the AARP shows a growing interest in aging in place among baby boomers and other generations. The AARP survey estimates that 76% of individuals ages 50 and older want to stay in their homes as they age, and 77% want to remain in their community for as long as possible. However, given that 90% of adults ages 50 and older still drive themselves, transportation becomes a crucial issue for older Americans. This is due to the potential safety concerns arising from changes in their driving abilities over time.
Declining birth rates
Over the past thirty years, there has been a general yet steady decrease in the birth rate in the United States. In 1990, the rate stood at 16.7 births per 1,000 people, which then dropped to 14.4 per 1,000 in 2000, further declined to 13 per 1,000 in 2010 and reached 10.9 births per 1,000 people in 2020.
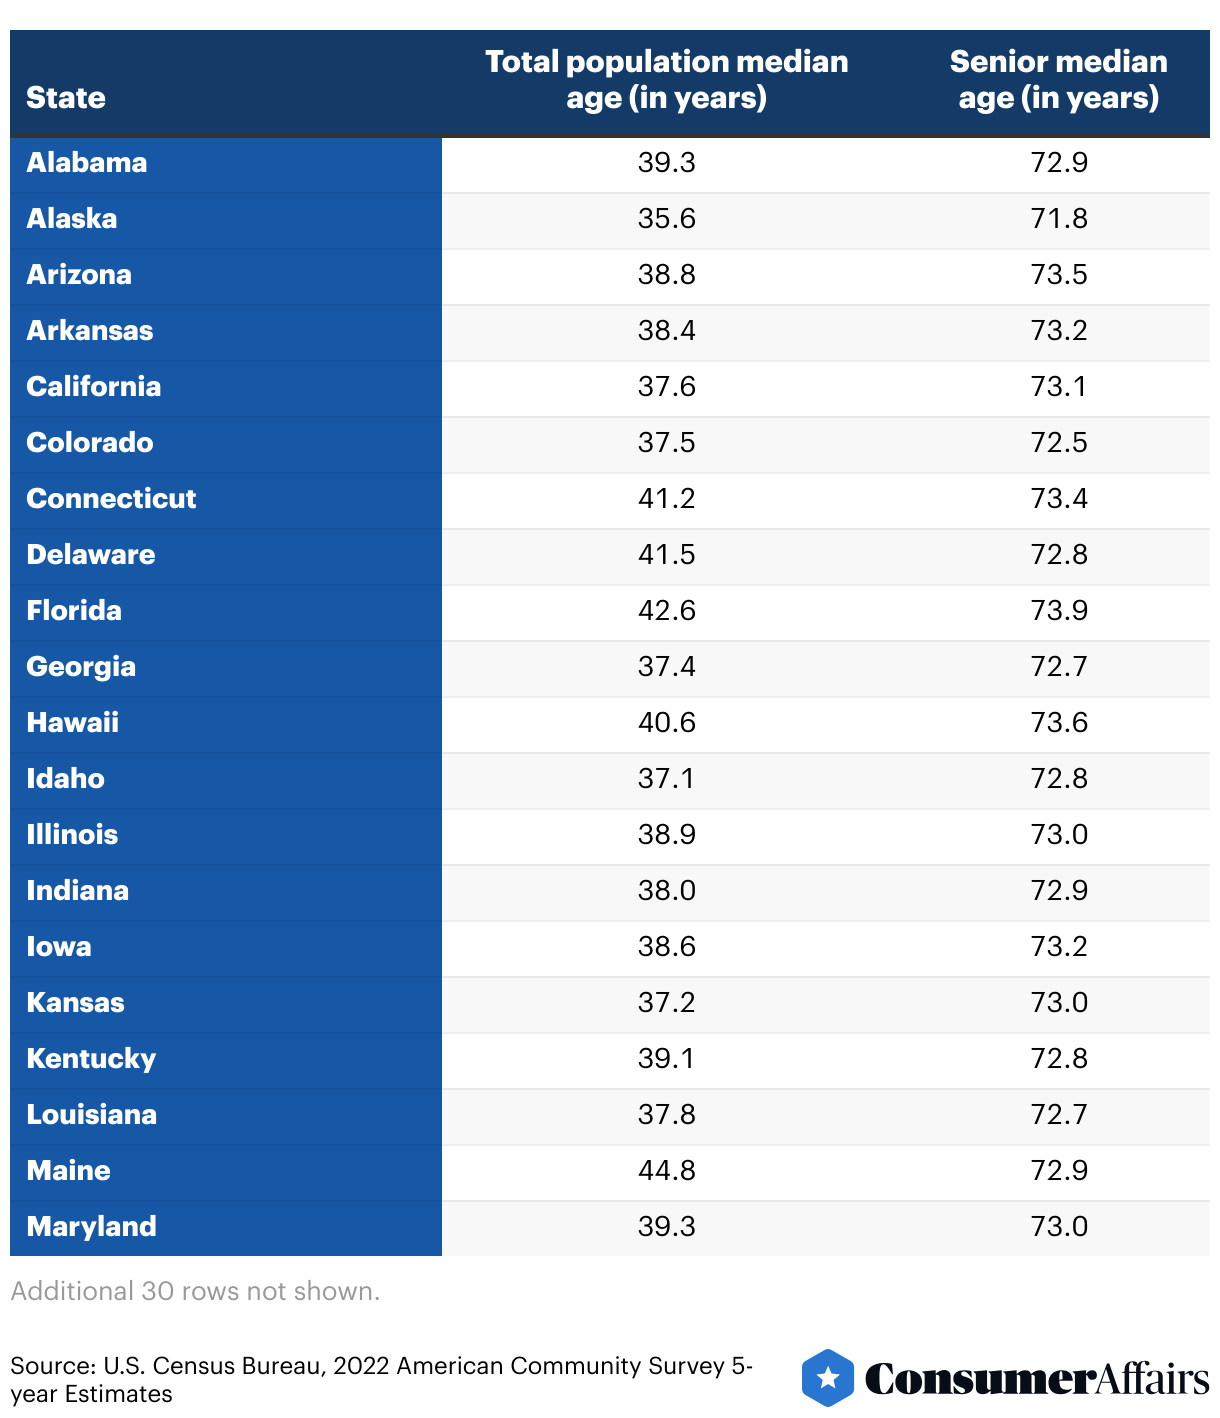
Median age by state
The median age in the U.S. is approximately 38.9 years. Utah has the lowest median age at 31.7 years, while Maine registers the highest among all states at 44.8 years.
Among seniors, the median age is 72.9 years, with Alaska's seniors having a lower median age of 71.8 years and Florida's seniors being older on average, at 73.9 years.
Bottom line
In the U.S., seniors make up 17.71% of the overall population. This percentage varies significantly across states, with Utah at the lower end with 12.16% and Maine at the higher end with 22.94%. Florida, California and Texas have the largest numbers of elderly residents, with 1 in 4 U.S. seniors living in one of these states. Conversely, the states with the smallest total senior populations are Alaska, Wyoming and North Dakota. For more information, read about elderly poverty statistics next.
Article sources
ConsumerAffairs writers primarily rely on government data, industry experts, and original research from other reputable publications to inform their work. Specific sources for this article include:
- U.S. Census Bureau, “2023: ACS 5-year Estimates.” Accessed Feb. 5, 2025.
- U.S. Census Bureau, “2023: ACS 1-year Estimates.” Accessed Feb. 5, 2025.
- U.S. Census Bureau, “2013: ACS 5-year Estimates.” Accessed Feb. 5, 2024.
- Maine Policy Review, “Maine’s Changing Demographics: Implications for Workforce, Economy, and Policy.” Accessed Jan. 25, 2024.
- Maine Policy Review, “Whither Maine’s Population.” Accessed Jan. 25, 2024.
- Maine Department of Health and Human Services, “Older Adult Health in Maine.” Accessed Jan. 26, 2024.
- U.S. Census Bureau, “The Older Population: 2020.” Accessed Jan. 20, 2024.
- State of Florida Department of Elder Affairs, “Florida State Plan on Aging 2022-2025.” Accessed Jan. 20, 2024.
- U.S. Census Bureau, “Race.” Accessed Jan. 17, 2024.
- Population Reference Bureau, “Fact Sheet: Aging in the United States.” Accessed Jan. 26, 2024.
- Population Reference Bureau, “Which U.S. States Have the Oldest Populations?” Accessed Jan. 26, 2024.
- AARP, “2018 Home and Community Preferences: A National Survey of Adults Ages 18-Plus.” Accessed Jan. 25, 2024.
- Statista, “Birth rate in the United States from 1990 to 2021.” Accessed Jan. 25, 2024.
Figures