Most dangerous cities for pedestrians and cyclists
+1 more
As a driver, you likely know it’s your responsibility to follow traffic laws, avoid distractions while behind the wheel and keep your car in good shape with regular maintenance (and the help of a good auto warranty).
However, a driver’s ultimate responsibility is to safely share the road with others — especially pedestrians and cyclists. Because they’re not protected by the outside “shield” of a car, these “vulnerable road users” are at greater risk for harm in a collision with a vehicle, according to the National Safety Council, a nonprofit that focuses on eliminating causes of preventable deaths and injuries. Each year, vehicle collisions kill about 8,000 pedestrians and cyclists and injure approximately 102,000 more.
“More people are being killed because cities are encouraging residents to walk and bike, but their roads are still dominated by fast-moving vehicular traffic,” John Rennie Short, a professor emeritus at the School of Public Policy at the University of Maryland, Baltimore County, wrote in The Conversation.
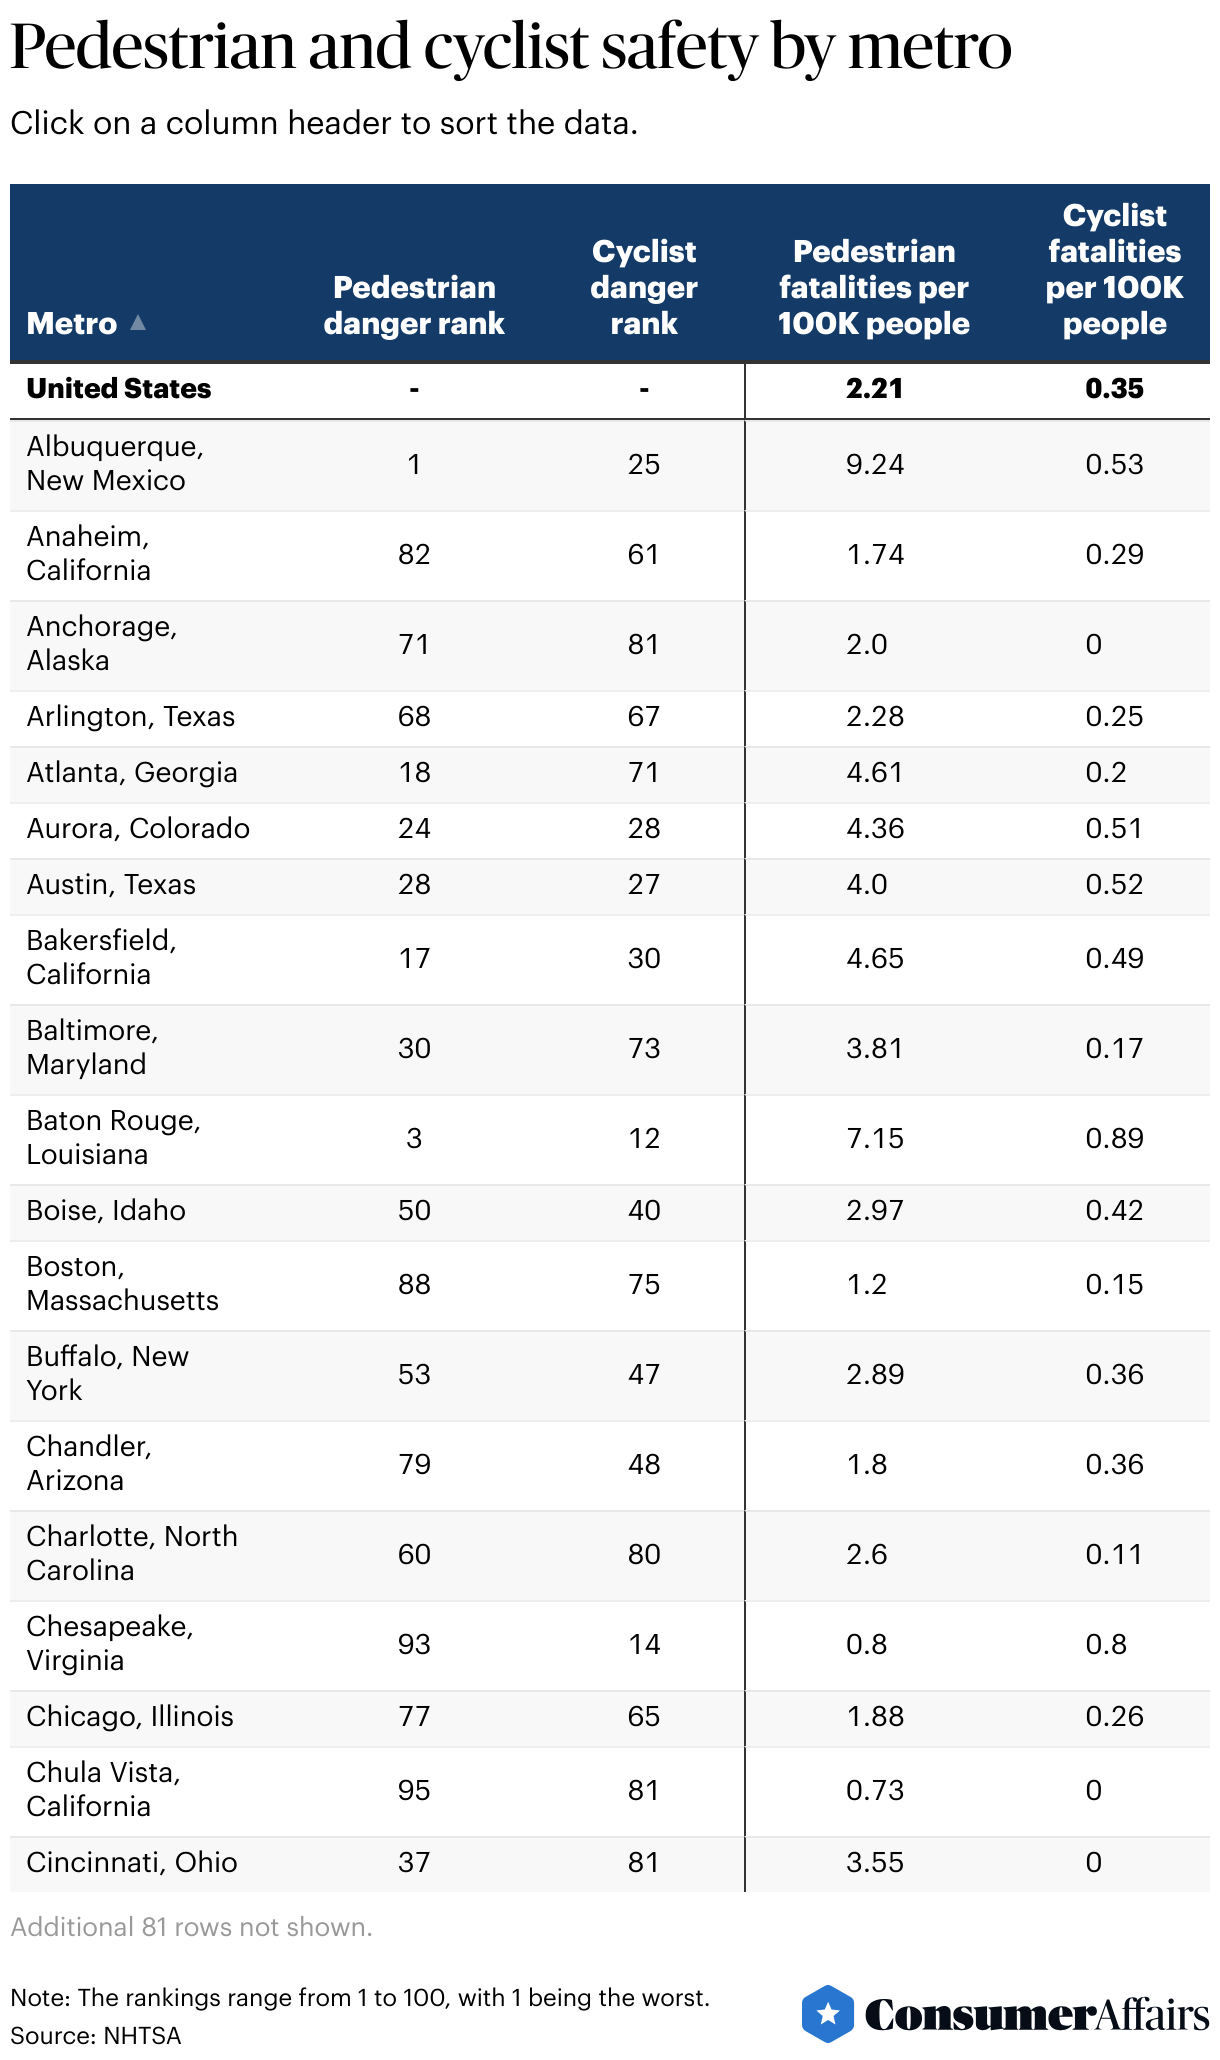
To uncover the most dangerous cities for people traveling on foot or by bike, the ConsumerAffairs Research Team analyzed the latest federal data on pedestrian and bicyclist fatalities in the 100 most populous metro areas. Read on to learn more about where these terrible tragedies occur the most and the steps you can take as a driver to better share the road.
Albuquerque, New Mexico, has the highest annual rate of pedestrian deaths, at 9.24 fatalities per 100,000 people.
Jump to insightThe safest city for pedestrians is Lincoln, Nebraska. It’s also the sole city on our list with only one pedestrian fatality in 2023.
Jump to insightStockton, California, is especially deadly for cyclists, with more than two fatalities per year per 100,000 residents.
Jump to insightArizona has three cities that appear in the top 10 most deadly places for both pedestrians and cyclists.
Jump to insightTwenty cities reported zero cyclist fatalities in 2023.
Jump to insightThe five worst cities for pedestrians
Reckless drivers, high speed limits and crumbling — or absent — infrastructure can all contribute to a hostile environment for those trying to walk, run or roll in a city. But the responsibility is shared by the vehicles on the road, too. Now, four out of five new cars sold in America are pickup trucks or SUVs, said David Zipper, a senior fellow at the MIT Mobility Initiative, in a recent interview with WBUR in Boston.
“We’re talking about cars that are bigger and heavier, so they’re going to exert more force in a crash with smaller vehicles. … People are even at more risk outside of the vehicle,” Zipper said. SUVs and trucks create bigger blind spots for drivers, and when a collision happens, the vehicle is more likely to hit someone’s head or torso than legs, resulting in more life-threatening injuries, he explained.
So, where in the U.S. do pedestrians face the greatest risks? We found that four out of the five most dangerous cities for pedestrians are in the South — but the worst city is in the West.
Read more about each city below.
1. Albuquerque, New Mexico
Albuquerque, New Mexico, has the highest rate of pedestrian deaths of all the cities we examined. Car crashes killed 52 pedestrians in 2023, which is a rate of 9.24 pedestrian fatalities per 100,000 residents. That’s more than four times the nationwide rate. Overall, nearly 50% of all traffic fatalities in the city involve someone on foot — way higher than the national figure of 18%.
A recent analysis by the news organization Stateline suggests that Albuquerque’s lack of infrastructure for pedestrians epitomizes the danger nationwide. “Pedestrians die at the highest rates not in brightly lit big cities where sidewalks are crowded with office workers, but in Western and Southern rural areas and small cities where poverty forces more people to walk on dark highways with inadequate sidewalks or shoulders,” Tim Henderson, a journalist for Stateline, wrote.
2. Memphis, Tennessee
Memphis saw 244 total car crash-related fatalities in 2023, the fourth most of all the cities we analyzed. A staggering 57 of those deaths — almost 1 in 4 — were pedestrians. Relative to the city’s population, that’s a rate of more than nine pedestrian fatalities per 100,000 residents, which is more than four times the national rate.
Pedestrians being at high risk in the Bluff City is not surprising, given that Memphis has the worst drivers in the country, according to a recent ConsumerAffairs study.
3. Baton Rouge, Louisiana
Baton Rouge ranks third worst for pedestrian safety. The city reported 16 pedestrian fatalities in 2023 — that’s a rate of more than seven pedestrian fatalities per 100,000 residents, which is more than three times the national rate. Overall, pedestrian fatalities made up more than 38 percent of all car crash-related fatalities that year.
4. Miami, Florida
In 2023, 31 pedestrians lost their lives to car crashes in Miami. That’s a rate of almost seven fatalities per 100,000 residents, more than three times the national average. A sobering 46.3% of all car crash fatalities in Miami, Florida, are pedestrians.
Miami isn’t the only Florida city with alarming statistics on pedestrian safety: Tampa and Orlando are also ranked in the top 20 worst cities for pedestrian fatalities. There may be a bright spot, however: A recent report from the Governors Highway Safety Association projects that pedestrian fatalities in Florida decreased by 8.5% from 2023 to 2024.
5. Lexington, Kentucky
Rounding out the list of most dangerous cities for pedestrians is Lexington, Kentucky. Of the 49 car crash-related fatalities in the city in 2023, 22 — or nearly 45% — were pedestrians. The fatality rate of 6.85 pedestrian fatalities per 100,000 residents is more than three times the rate across the U.S.
Lexington is taking some steps to improve pedestrian safety. In a new pilot program, one of the city’s busiest intersections is undergoing construction to reduce two lanes of traffic down to one and make additional changes aimed at boosting pedestrian and cyclist safety. Based on the success of the pilot program, the city may implement these same measures in other locations around Lexington.
What are the most dangerous cities for cyclists?
A city may be difficult or dangerous for a cyclist to navigate for a number of reasons, from a lack of biking infrastructure (such as bike paths or separated bike lanes) to a culture of aggressive or reckless driving. “More can be done to address cyclist safety,” said Ken McLeod, policy director at the League of American Bicyclists, in a recent press release. But which cities present the greatest risks?
Of the five worst cities for cyclist safety, two are in northern California and the rest are spread across the Sun Belt. For a closer look into each metro, read on.
1. Stockton, California
Stockton, California, earned the worst rank for cyclist safety with seven cyclist fatalities in 2023, or a rate of 2.18 cyclist deaths per 100,000 residents — more than six times the national average. Cyclist fatalities constitute a staggering 20% of all fatalities from car crashes in the city. (For reference: Nationwide, cyclist fatalities make up just 2.9% of all car crash-related fatalities.)
However, some infrastructure projects aimed at improving cyclist safety are on the way. In March 2025, the San Joaquin Council of Governments approved $6.5 million in funding to implement the Citywide Stockton Bicycle-Pedestrian Connectivity Project, which will create an “active transportation network” aimed at improving walking and biking access to schools and adjacent neighborhoods. Stockton is also at work on the Downtown Stockton East-West Connection project to improve roadways by adding bike lanes and other cycling infrastructure, with construction expected to conclude by November 2026.
2. New Orleans, Louisiana
Safely navigating the Big Easy on two wheels can be challenging — and dangerous. New Orleans had the same number of cyclist fatalities as Stockton (seven) in the latest data year, for a rate of 1.86 cyclist fatalities per 100,000 residents. That’s more than five times the national average. Nearly 12% of all car crash fatalities in New Orleans are cyclist deaths.
Unfortunately, statistics like these aren't new for New Orleans: The city has been facing a crisis of cyclist safety for several years. From 2017 to 2021, New Orleans had the highest rate of fatal bicycle crashes of all major metros in the U.S. And from 2009 to 2023, a total of 53 cyclists were killed in car crashes.
3. Tampa, Florida
In Tampa, cyclist fatalities make up almost 12% of all car crash fatalities. In 2023, car crashes killed six cyclists in the Gulf Coast city. That’s a rate of 1.53 fatalities per 100,000 residents — over four times the national average. In cities like Tampa, there may be a link between heavy traffic congestion and poor cyclist safety: Among the five most dangerous cities for cyclists, Tampa has the worst traffic.
Unfortunately, Tampa isn’t the only Florida city with a high rate of cyclist deaths. Orlando ranks seventh, and St. Petersburg, also located in the Tampa Bay area, ranks ninth for danger to cyclists.
4. Sacramento, California
Just 50 miles from worst-ranked Stockton is Sacramento, ranked fourth worst for cyclist safety. The city had eight cyclist fatalities in 2023, which translates to a rate of just over 1.5 cyclist fatalities per 100,000 people. That’s more than four times the national average.
In this summer’s city ratings by the organization PeopleForBikes, Sacramento earned a poor score, 36 out of 100, with significant swaths of the city flagged as “high-stress” areas for biking. Shockingly, this score was still technically above average: The average score for all cities PeopleForBikes rated in 2025 was just 30.
5. Tucson, Arizona
With a population of more than 543,000, Tucson is the largest metro of the 15 cities ranked worst for cyclist safety. In 2023, there were 147 total car crash fatalities — the 10th most of all the cities we compared. Eight of those lives lost were cyclists. Overall, Tucson has a rate of 1.47 cyclist fatalities per 100,000 residents. That’s over four times worse than the national average.
The tragic number of cyclist fatalities — and total car crash fatalities — in Tucson is consistent with our finding that the Old Pueblo is among the cities with the worst drivers in 2024, ranking 20th out of more than 320 cities we compared.
How safe is your city for pedestrians and cyclists?
Where in the U.S. do pedestrians and cyclists face the greatest danger? One state appeared more in the worst rankings than any other: Arizona metros take three of the worst 10 spots in each of the pedestrian and cyclist rankings. (Phoenix, Tucson and Glendale are the most dangerous Arizona cities for pedestrians; for cyclists, it’s Tucson, Mesa and Glendale.)
While our emphasis is on the cities that are most dangerous for pedestrians and cyclists, it’s important to note that many cities are very safe for the most vulnerable road users. Lincoln, Nebraska, reported only one pedestrian fatality in 2023, making it the safest city for pedestrians in our analysis. And on the biking front, 20 cities reported zero cyclist fatalities in 2023.
Check out the data below to see how your city compares.
How drivers can look out for pedestrians and cyclists
Reviewing data on pedestrian and cyclist safety is a good place to start, but what else can drivers do to improve the experience of those who walk or roll through their communities?
Try the following steps to become a more pedestrian- and cyclist-friendly driver:
- Use the “Dutch reach.” Open your driver-side door with your right hand to naturally turn your body and look back for oncoming cyclists. Crack the door while you scan the road, and only open the door fully when you’ve confirmed it won’t present a “dooring” hazard for an oncoming rider.
- Know your blind spots, especially in a larger vehicle. All cars have blind spots, but SUVs and trucks have particularly major ones due to the “A pillar” between the side window and the windshield. “On a tall SUV and truck, those pillars are pretty big, and they can easily conceal a pedestrian,” particularly while turning, said Zipper from the MIT Mobility Initiative.
- Expect the unexpected. Cyclists may need to slow down or weave to avoid potholes, bumps or other road hazards a driver might not think twice about. When you’re sharing the road with a biker, give them even more of a buffer than you think you need to.
- Explore your neighborhood on two feet — or two wheels. Studies have found that drivers who are also cyclists are significantly faster than other drivers at identifying changes in a road scene, especially changes involving bicycle or road signs. Join a group bike ride, or try cycling for your commute or weekend errands to practice empathy and attention to the challenges pedestrians and bikers face.
- Advocate for safer streets. While responsible driving behavior is critical for pedestrian and cyclist safety, nothing is a substitute for walking and biking infrastructure. Plug into your local efforts to improve or install sidewalks, crosswalks, bike lanes and street lighting to help create safe places for residents to walk or roll.
Methodology
The ConsumerAffairs Research Team identified the most dangerous U.S. cities for pedestrians and cyclists by analyzing 2023 crash data from the National Highway Traffic Safety Administration’s (NHTSA) Fatality Analysis Reporting System (FARS), the most recent data available. Our analysis focused on the 100 most populous metropolitan areas.
We created two separate rankings based on the number of pedestrian and cyclist fatalities reported in each metro area. For each, we calculated the fatality rate per 100,000 residents. Cities with higher fatality rates received higher scores on a 100-point scale; the city with the highest fatality rate was given a score of 100, and other cities received relative scores.
To provide additional context, we also collected the total number of fatalities from all types of motor vehicle crashes in 2023. Using this data, we calculated what proportion of total traffic deaths were of pedestrians or cyclists. This percentage was not factored into the final rankings but is included as broader context.
Reference policy
We love it when people share our findings! If you do, please link back to our original article to credit our research.
Questions?
For questions about the data or if you'd like to set up an interview, please contact rsowell@consumeraffairs.com.
Article sources
ConsumerAffairs writers primarily rely on government data, industry experts and original research from other reputable publications to inform their work. Specific sources for this article include:
- National Highway Traffic Safety Administration, “Fatality Analysis Reporting System (FARS).” Accessed July 21, 2025.
- National Safety Council, “Position/Policy Statement: Vulnerable Road Users.” Accessed July 21, 2025.
- U.S. Department of Transportation Federal Highway Administration, “Pedestrian & Bicycle Safety.” Accessed July 21, 2025.
- The Conversation, “Why US cities are becoming more dangerous for cyclists and pedestrians.” Accessed July 21, 2025.
- WBUR, “Why large cars are a public health hazard, according to one expert.” Accessed July 21, 2025.
- Stateline, “Dark highways, fast cars, few sidewalks — and more pedestrian deaths.” Accessed July 21, 2025.
- Governors Highway Safety Association, “Spotlight on Highway Safety: Pedestrian Traffic Fatalities by State January - June 2024 Preliminary Data.” Accessed July 21, 2025.
- LEXtoday, “Pedestrian safety pilot program comes to High Street.” Accessed July 21, 2025.
- League of American Bicyclists, “Another Year of Devastating and Preventable Bicyclist Deaths.” Accessed July 21, 2025.
- San Joaquin Council of Governments, “SJCOG Board approves $14.7 million to improve safety, connectivity for pedestrians, cyclists.” Accessed July 21, 2025.
- City of Stockton, “Downtown Stockton East-West Connection.” Accessed July 21, 2025.
- Axios, “New Orleans leads country in bicyclist deaths per capita.” Accessed July 21, 2025.
- PeopleForBikes, “City Ratings: Sacramento.” Accessed July 21, 2025.
- WBUR, “Trucks and SUVs are bigger — and more dangerous — than ever. New safety rules aim to fix that.” Accessed July 21, 2025.
- Accident Analysis & Prevention, “Do cyclists make better drivers? Associations between cycling experience and change detection in road scenes.” Accessed July 21, 2025.
Figures