How Many People Have Pet Insurance? (2026 Data)
+1 more

For millions of Americans, pets are, quite simply, members of the family. Highlighting our passion for pets—whether of the furry, four-legged or feathered variety—is the exponential rise of pet insurance. But what, exactly, does pet insurance cover? And is it worth the cost?
Read on for key pet insurance statistics, along with helpful guidance that can help determine whether it’s a sound investment for your beloved animal.
The global pet insurance market is expected to be worth more than $11.2 billion by 2026.
Jump to insightApproximately 66% of U.S. households (almost 87 million) own a pet.
Jump to insightAccording to the latest data available, more than 4.8 million pets were insured in the U.S.
Jump to insightOn average, dog owners spend nearly $1,500 per year on their animal, while cat owners spend just over $900 on their favorite feline.
Jump to insightPet ownership statistics
As of 2024, the U.S. has a total population exceeding 336 million. Of the entire country, an estimated 86.9 million households report owning a pet, which equates to approximately 66% of all U.S. households.
Dogs are by far the most popular U.S. pet. According to data compiled by the American Pet Products Association, 69 million U.S. households own a dog, while approximately 45 million own a cat.
Pets are not exclusive to any particular age cohort, though Millennials do comprise the highest percentage of pet ownership:
- Silent generation: 2%
- Generation Z: 16%
- Baby boomers: 24%
- Generation X: 25%
- Millennials: 33%
For 2023, U.S. pet expenditures are projected to exceed $143 billion. Of that number, pet owners spent an estimated:
- $37 billion on vet care and products
- Nearly $12 billion on boarding, grooming, insurance, training and pet sitting
- $62.7 billion on pet food and treats
- $32.1 billion on supplies, live animals and over-the-counter medicine
On average, dog owners spend nearly $1,500 per year on their pooch, while cat owners spend just over $900.
| Expense | Dog | Cat |
|---|---|---|
| Surgical vet | $458 | $201 |
| Food | $287 | $254 |
| Routine visit | $242 | $178 |
| Kennel boarding | $228 | $78 |
| Food treats | $81 | $72 |
| Vitamins | $81 | $47 |
| Toys | $56 | $41 |
| Groomer/grooming aids | $47 | $31 |
| Total | $1,480 | $902 |
Pet insurance market trends
The U.S. pet insurance market is estimated to be $3.2 billion USD in 2022, up 24.2% compared to 2021. The global pet insurance market, meanwhile, is expected to reach $11.25 billion by 2026.
At the end of 2022, roughly 4.8 million pets (80.1% dogs, 19.9% cats) in North America were insured, up from just 3.9 million in 2021. While more dogs are insured than cats, the pet insurance market for cats experienced a 30% year-over-year growth between 2021 and 2022.
Additional pet insurance market trends, insights and facts include:
- Nearly 93% of owners chose accident and illness and comprehensive insurance coverage for their pets.
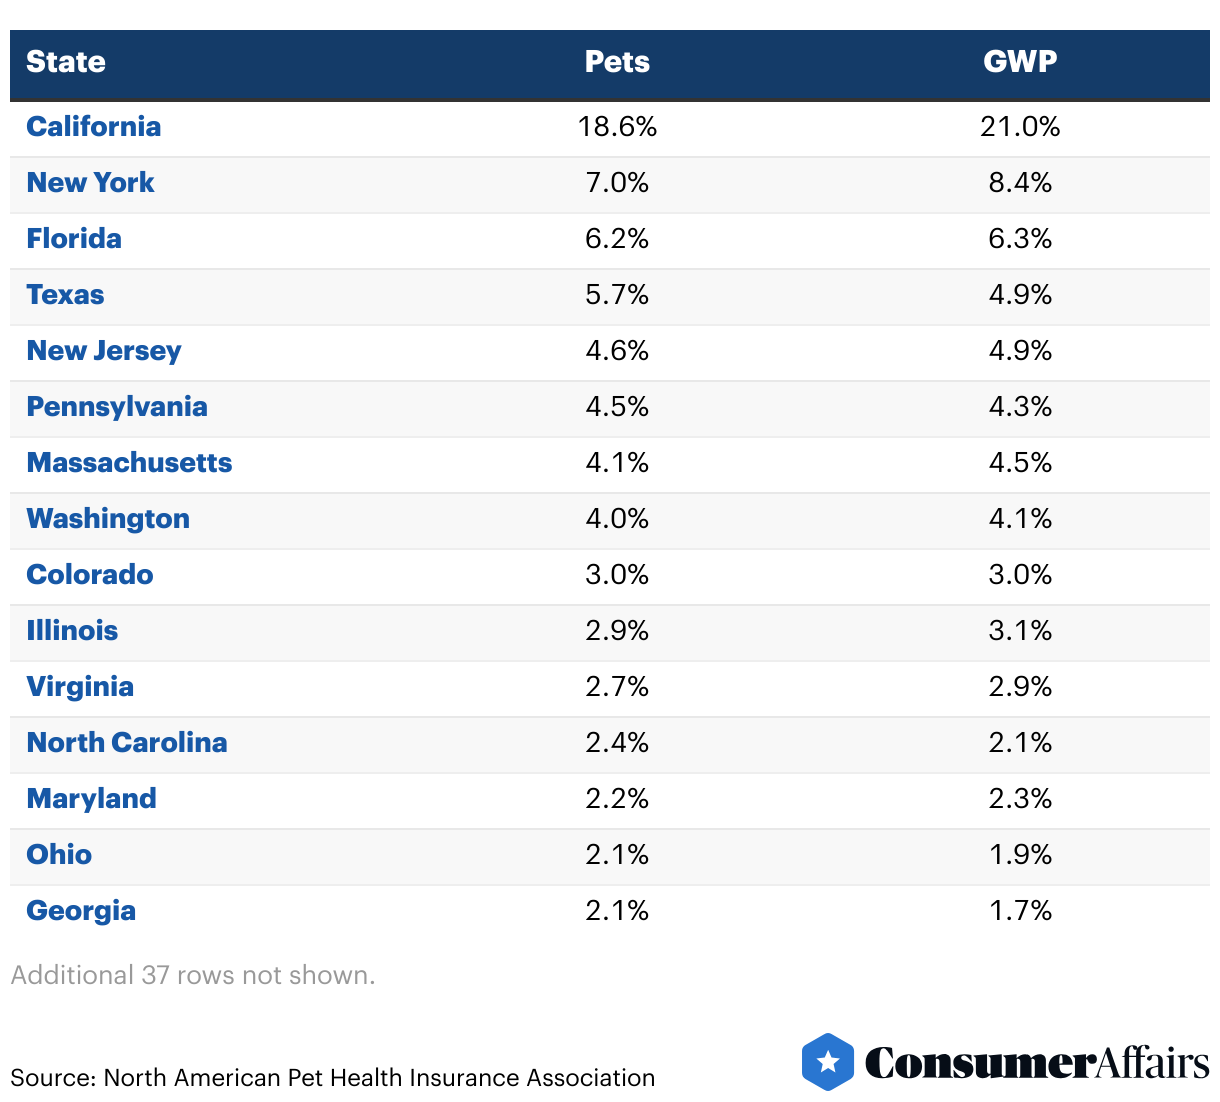
- States with the most pets and the most insured pets are California, New York and Florida.
- Wyoming and Mississippi have the lowest premiums for cats, averaging $19.35 and $19.77 per month, respectively.
- Arizona and California have the highest premiums for cats, averaging $31.96 and $31.97 per month, respectively.
- Wyoming and Mississippi have the lowest premiums for dogs, averaging $33.97 and $34.17 per month, respectively.
- California and New York have the highest average premiums for dogs, averaging $61.29 and $61.05 per month, respectively.
The number of pets insured throughout North America has risen steadily each year since 2018.
| Year | Value (in billion USD) | Total number of pets insured |
|---|---|---|
| 2018 | 1.254 | ~2.2 million |
| 2019 | 1.558 | ~2.5 million |
| 2020 | 1.986 | ~3.1 million |
| 2021 | 2.591 | ~4 million |
| 2022 | 3.218 | ~4.8 million |
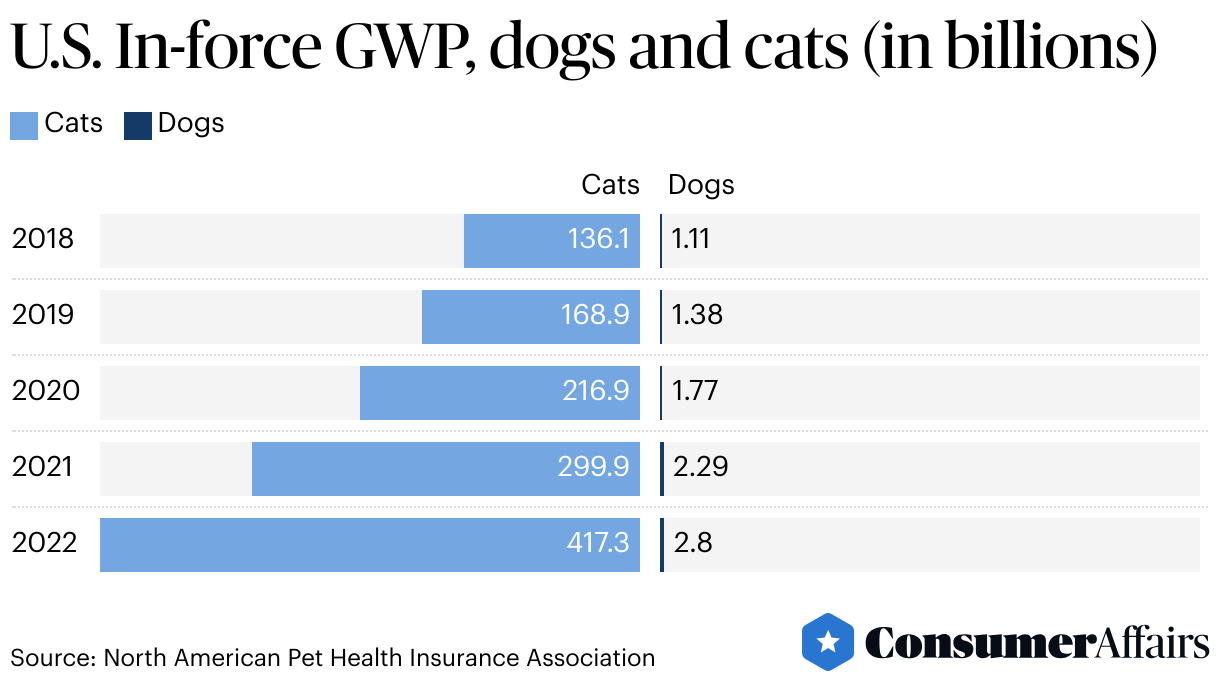
According to data compiled by the North American Pet Health Insurance Association, the U.S. market for pets and GWP distribution by state is as follows:
Number of insured dogs and cats
According to the North American Pet Health Insurance Association, 4,849,540 pets were insured in the U.S. in 2022 (0.96 million cats and nearly 3.9 million dogs.
The number of cats and dogs insured in the U.S. both continue to rise each year.
| Year | Cats insured | Dogs insured |
|---|---|---|
| 2022 | 0.964 million | 3.885 million |
| 2021 | 0.726 million | 3.244 million |
| 2020 | 0.531 million | 2.57 million |
| 2019 | 0.419 million | 2.097 million |
| 2018 | 0.348 million | 1.808 million |
While more dogs are insured throughout the U.S., the percentage of cats being insured appears to be rising at a sharper rate. Below is a year-over-year table showing the rate of each animal’s pet insurance growth.
| Year | Dogs | Cats | Combined | Total pets |
|---|---|---|---|---|
| 2022 | 19.7% | 32.9% | 22.1% | 4,849,540 |
| 2021 | 26.2% | 36.7% | 28.0% | 3,970,535 |
| 2020 | 22.5% | 26.7% | 23.2% | 3,101,956 |
| 2019 | 16.0% | 20.4% | 16.7% | 2,517,122 |
FAQ
How many people in the U.S. have pet insurance?
According to the latest data, more than 4.8 million pets in the U.S. are insured.
How many pets are insured in America?
There were about 4.8 million insured pets in 2022, up from 2.2 million pets in 2018.
How much does pet insurance cost?
It depends on the type of animal you have and where you live. Dogs typically cost more to insure than cats.
What states have the cheapest pet insurance?
Wyoming and Mississippi have the lowest premiums for cats and for dogs, averaging $19.35 and $19.77 per month for cats, respectively—and averaging $33.97 and $34.17 per month, respectively, for dogs.
Article sources
ConsumerAffairs writers primarily rely on government data, industry experts, and original research from other reputable publications to inform their work. Specific sources for this article include:
- U.S. Census Bureau, “U.S. World and Population Clock.” Accessed Mar. 18, 2024.
- Insurance Information Institute, “Facts + Statistics: Pet Ownership and Insurance.” Accessed Mar. 18, 2024.
- Fortune Business Insights, “Pet insurance market size, share and industry analysis.” Accessed Mar. 18, 2024.
- North American Pet Health Insurance Association, “Total pets insured.” Accessed Mar. 18, 2024.
- North American Pet Health Insurance Association, “State of the industry report 2023 highlights.” Accessed Mar. 18, 2024.
- PawlicyAdvisor, “Average pet insurance cost in 2022 by breed, age and state.” Accessed Mar. 18, 2024.
Figures