States With the Worst Road Rage in (2026 Data)
+1 more
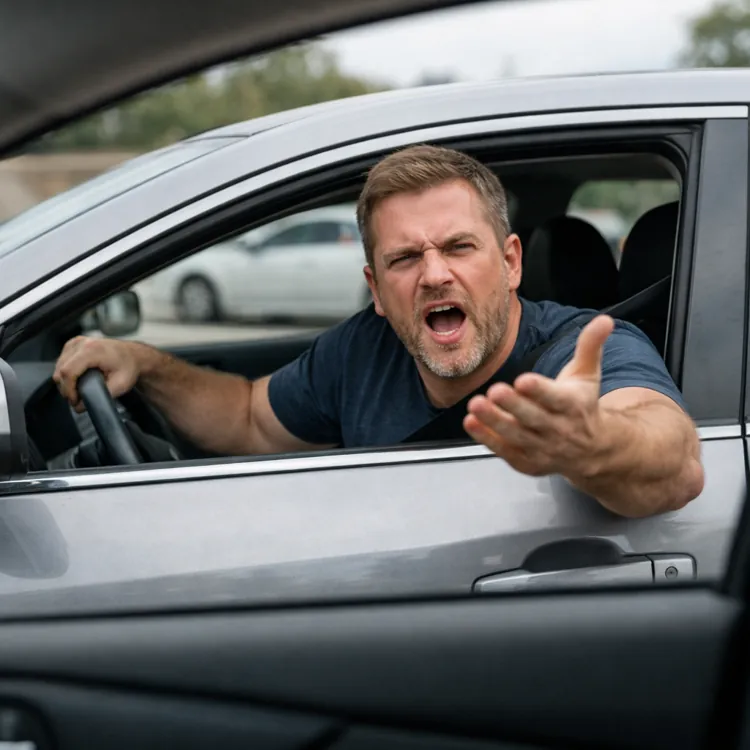
When’s the last time you experienced road rage? Chances are, it’s not too far in your rearview. According to recent research from the AAA Foundation for Traffic Safety, a staggering 96% of drivers reported engaging in aggressive driving or road rage behavior within the past year.
It’s only human for stressful emotions to arise on the road. “When another driver cuts you off in traffic or drives too close, your brain does not detect this as a minor inconvenience, but as a serious threat,” said Matthew Bernarda, a licensed therapist in Orange County, California. “Road rage is not just bad manners or impatience. It is a complex psychological event that can escalate in a matter of seconds.”
Unfortunately, even the most coolheaded motorists may find themselves on the receiving end of someone else’s road rage. You can get an extended auto warranty, follow the speed limit and keep both hands on the wheel, but another driver’s rash actions can have dangerous and even deadly consequences.
While road rage happens everywhere, data indicates that it’s more common in some places than others. To identify the worst states for road rage, the ConsumerAffairs Research Team analyzed data on fatal crashes related to aggressive or careless driving, dangerous driving violations and traffic incidents involving gun violence. See how your state ranks below.
Arkansas ranks No. 1 for road rage in 2026, dethroning Louisiana after its two-year run at the top.
Jump to insightNew Mexico maintains its No. 2 spot for road rage, largely due to having the nation’s highest rate of traffic incidents involving gun violence.
Jump to insightFor the second consecutive year, drivers in Maine have the lowest level of road rage.
Jump to insightKentucky saw the biggest improvement year over year, falling 16 spots to No. 42.
Jump to insightNebraska had one of the largest increases in road rage, jumping from No. 44 in 2025 to No. 22 in 2026.
Jump to insightThe 10 states with the most road rage
No region is a monolith, but the South and West appear to have more road rage than other parts of the country. The West leads the way, with five states in the top 10, while the South contributes three. A single state from the Northeast and one from the Midwest round out the top 10.
Overall, the top 10 list is very dynamic compared with our past analyses. Only one state in the top 10 didn’t change rank from last year. The rest moved up or down by one to four positions.
Check out the map below for a bird’s-eye view of the most hostile motorists in America. Then, read on for a closer look at the top-ranked states.

1. Arkansas
Louisiana held the top spot for the past two years, but Arkansas rose to the No. 1 position to rank as the state with the worst road rage in 2026. This shake-up didn’t come out of left field: Arkansas has been steadily climbing the ranks, from No. 5 in 2024 to No. 4 in 2025.
Arkansas leads the nation in both deadly accidents and accident-related deaths tied to aggressive or careless driving. These behaviors are involved in nearly half of all fatal crashes and traffic fatalities in the state — both the highest rates in the country. Traffic incidents involving gun violence are up the most of any state year over year.
Key stats:
- Traffic incidents involving gun violence: 0.36 per 100,000 people
- Traffic violations for aggressive/careless driving or speeding: 0.58 per 100,000 people
- Fatal accidents involving aggressive or careless driving: 8.35 per 100,000 people (highest in the U.S.)
- Accounted for 47% of all fatal crashes in the state (highest)
- Fatalities involving aggressive or careless driving: 9.33 per 100,000 people (highest)
- Accounted for 48% of all traffic fatalities in the state (highest)
2. New Mexico
New Mexico ranks second worst for road rage, with an aggregate score just a hair behind top-ranked Arkansas. This is the third year in a row that New Mexico has finished No. 2 for combative driving. Interestingly, it's the only state in the top 10 (and one of just four states total) to have the same rank as in 2025.
New Mexico’s road rage score is primarily driven by its alarming rate of traffic incidents involving gun violence — the highest in America, by far. The state also has the third-highest rates of fatal crashes and deaths involving aggressive or careless driving.
Key stats:
- Traffic incidents involving gun violence: 1.69 per 100,000 people (highest in the U.S.)
- Traffic violations for aggressive/careless driving or speeding: 0.66 per 100,000 people
- Fatal accidents involving aggressive or careless driving: 6.62 per 100,000 people (third highest)
- Accounted for 37% of all fatal crashes in the state (sixth highest)
- Fatalities involving aggressive or careless driving: 7.37 per 100,000 people (third highest)
- Accounted for 38% of all traffic fatalities in the state (sixth highest)
3. Louisiana
Louisiana ranks third worst for road rage now, but for the past two years, it ranked as the worst state in the country. So, why the decrease in rank?
The answer is a potential bright spot for a state that continues to struggle with dangerous driving behavior. Year over year, the Bayou State saw noteworthy decreases in the rates of fatal crashes and deaths involving aggressive or careless driving, with each metric improving by close to 25%.
Aggressive or careless driving is also involved in a smaller share of all fatal crashes in the state — 46%, compared with 57% last year.
Key stats:
- Traffic incidents involving gun violence: 0.50 per 100,000 people
- Traffic violations for aggressive/careless driving or speeding: 1.24 per 100,000 people (fourth highest in the U.S.)
- Fatal accidents involving aggressive or careless driving: 7.09 per 100,000 people (second highest)
- Accounted for 46% of all fatal crashes in the state (second highest)
- Fatalities involving aggressive or careless driving: 7.66 per 100,000 people (second highest)
- Accounted for 47% of all traffic fatalities in the state (second highest)
4. Colorado
Colorado ranks fourth worst for road rage overall, but the Centennial State has a particular issue with reckless driving behavior. It has the highest rate of violations involving careless driving or speeding, at 2.65 per 100,000 people, including a sizable year-over-year increase (46.5%).
Recently, public officials in Colorado have been looking to curb speeding. In May 2026, the state Legislature passed a law that would increase penalties for repeat speeding offenders and drivers caught going over 100 mph, which the governor then signed into law.
Key stats:
- Traffic incidents involving gun violence: 0.65 per 100,000 people (ninth highest in the U.S.)
- Traffic violations for aggressive/careless driving or speeding: 2.65 per 100,000 people (highest)
- Fatal accidents involving aggressive or careless driving: 4.28 per 100,000 people (fifth highest)
- Accounted for 40% of all fatal crashes in the state (fifth highest)
- Fatalities involving aggressive or careless driving: 4.65 per 100,000 people (fifth highest)
- Accounted for 40% of all traffic fatalities in the state (fifth highest)
5. New Jersey
New Jersey ranks fifth worst overall for road rage, including third worst state for traffic violations involving reckless driving or speeding, with a rate more than three times the national figure. However, its most notable metric might be in its rate of traffic incidents involving gun violence: just 0.06 per 100,000 people.
This remains among the lowest rates in the country (about 85% lower than the national rate) and is by far the lowest in the 10 worst states for road rage.
Key stats:
- Traffic incidents involving gun violence: 0.06 per 100,000 people (eighth lowest in the U.S.)
- Traffic violations for aggressive/careless driving or speeding: 1.51 per 100,000 people (third highest)
- Fatal accidents involving aggressive or careless driving: 3.03 per 100,000 people (ninth highest)
- Accounted for 45% of all fatal crashes in the state (third highest)
- Fatalities involving aggressive or careless driving: 3.22 per 100,000 people (10th highest)
- Accounted for 46% of all traffic fatalities in the state (third highest)
6. Nevada
Nevada ranks as the sixth-worst state for road rage and has some of the most consistent rankings across all the key metrics we compared.
Traffic incidents involving gun violence are of particular concern. Nevada has the sixth-highest rate in the country, and these incidents are up 38%. Nevada also sees a high rate of traffic violations involving careless or aggressive driving or speeding — more than double the national average.
Key stats:
- Traffic incidents involving gun violence: 0.70 per 100,000 people (sixth highest in the U.S.)
- Traffic violations for aggressive/careless driving or speeding: 0.89 per 100,000 people (sixth highest)
- Fatal accidents involving aggressive or careless driving: 3.70 per 100,000 people (sixth highest)
- Accounted for 32% of all fatal crashes in the state (seventh highest)
- Fatalities involving aggressive or careless driving: 4.28 per 100,000 people (sixth highest)
- Accounted for 34% of all traffic fatalities in the state (eighth highest)
7. Montana
Montana may have the smallest population among the worst states for road rage, but that doesn’t spare it from high rates of fatal accidents and deaths involving aggressive or careless driving. It ranks fourth worst in the country in each of those metrics, with rates far above the national numbers.
Tragically, reckless driving habits in the Treasure State seem to start young. Montana ranked as the state with the worst teen drivers in our 2025 analysis.
Key stats:
- Traffic incidents involving gun violence: 0.18 per 100,000 people
- Traffic violations for aggressive/careless driving or speeding: 0.44 per 100,000 people
- Fatal accidents involving aggressive or careless driving: 5.10 per 100,000 people (fourth highest in the U.S.)
- Accounted for 30% of all fatal crashes in the state (ninth highest)
- Fatalities involving aggressive or careless driving: 5.19 per 100,000 people (fourth highest)
- Accounted for 29% of all traffic fatalities in the state (ninth highest)
8. Wisconsin
Does “Midwest nice” translate to roadways? Maybe — just not in the Badger State. Ranking eighth worst for road rage is Wisconsin, the only Midwestern state to rank in the top 10.
Wisconsin ranked outside the top 10 last year, only to climb four positions in our 2026 analysis. Fatalities related to aggressive or careless driving are up almost a third year over year, and fatal crashes involving these behaviors are up 28%.
Wisconsin is also one of the worst states for traffic incidents involving gun violence. However, the rate is down 17% from last year.
Key stats:
- Traffic incidents involving gun violence: 0.70 per 100,000 people (fifth worst in the U.S.)
- Traffic violations for aggressive/careless driving or speeding: 0.45 per 100,000 people
- Fatal accidents involving aggressive or careless driving: 2.80 per 100,000 people
- Accounted for 32% of all fatal crashes in the state (eighth highest)
- Fatalities involving aggressive or careless driving: 3.37 per 100,000 people (ninth highest)
- Accounted for 34% of all traffic fatalities in the state (seventh highest)
9. Hawaii
On Hawaii’s roadways, the “spirit of aloha” sometimes takes a back seat to short tempers and anger behind the wheel. Hawaii ranks as the ninth-worst state for road rage, with high percentages of traffic crashes and deaths related to aggressive or careless driving.
Interestingly, Hawaii’s key metrics are slightly better across the board than in last year’s analysis. With these improvements, the state finishes one spot lower than last in 2025, but it’s still ranking far worse than in the first year of our analysis (No. 34 in 2024).
Key stats:
- Traffic incidents involving gun violence: 0.14 per 100,000 people
- Traffic violations for aggressive/careless driving or speeding: 0.07 per 100,000 people (10th lowest in the U.S.)
- Fatal accidents involving aggressive or careless driving: 2.90 per 100,000 people (10th highest)
- Accounted for 43% of all fatal crashes in the state (fourth highest)
- Fatalities involving aggressive or careless driving: 3.18 per 100,000 people
- Accounted for 45% of all traffic fatalities in the state (fourth highest)
10. North Carolina
Rounding out the list is North Carolina. With 1,509 total fatal crashes and 1,619 total traffic deaths related to aggressive or careless driving, it has the highest raw numbers among the 10 worst states for road rage.
The Tar Heel State also seems to have no shortage of drivers with a lead foot. There’s been an enormous increase in traffic violations related to aggressive or careless driving or speeding — up 88% from the previous year.
In the big picture, the data points to conditions improving — albeit slightly. While North Carolina still ranks among the top 10 states, it fell three places this year from No. 7, where it had held steady for two years.
Key stats:
- Traffic incidents involving gun violence: 0.51 per 100,000 people
- Traffic violations for aggressive/careless driving or speeding: 0.70 per 100,000 people (ninth highest in the U.S.)
- Fatal accidents involving aggressive or careless driving: 3.30 per 100,000 people (eighth highest)
- Accounted for 24% of all fatal crashes in the state
- Fatalities involving aggressive or careless driving: 3.49 per 100,000 people (seventh highest)
- Accounted for 24% of all traffic fatalities in the state
States with the least road rage
Unlike the states with the worst road rage, the states with the least aggressive drivers are evenly distributed throughout the country. They include a balance of coastal and heartland states with a wide range of populations.
And while many people may associate traffic congestion with road rage, the relationship may not be so clear-cut. California, for example, is home to four of the 10 cities with the worst traffic — the largest cluster of any state — and has more drivers on the road than any other state. But the Golden State takes the No. 2 spot for least road rage.
But the states with the least road rage are fairly consistent compared with last year’s analysis. While there’s been some shuffling, six states that finished in the 10 states with the least road rage last year stayed in that grouping. And for the second year in a row, Maine ranks No. 1 for states with the least road rage. (Just two states — Kentucky and Ohio — are appearing in the bottom 10 for the first time in the three years we’ve done the analysis.)
Our analysis ranks the following states lowest for road rage:
- Maine
- California
- Utah
- Iowa
- Ohio
- Virginia
- New Hampshire
- Washington
- Mississippi
- Kentucky
How does road rage vary across states?
Kentucky saw the biggest year-over-year improvement in rank, falling 16 spots to No. 42. Other states improving in rank include Delaware (fell 14 spots to No. 30), Alaska (fell 13 spots to No. 38) and Washington (fell 12 spots to No. 44).
At the same time, several states made big turns in the wrong direction:
- Nebraska had the largest increase in road rage: In last year’s analysis, it ranked among the bottom 10 states, at No. 44. For 2026, it jumped 22 places into the top half of states (No. 22).
- North Dakota made a parallel jump. In 2025, it ranked among the states with the least road rage; in 2026, it jumped 22 places to No. 23.
- Both states saw enormous year-over-year increases in the rate of deaths and fatal crashes involving aggressive or careless driving.
The good news? At the national level, the rates of fatal crashes and fatalities involving aggressive or careless driving have fallen. Each has decreased by nearly 15%.
At the state level, though, your mileage may vary. Curious how your state ranks? Check out the full data table below.
What causes road rage — and how to cope
Whether or not road rage is a familiar feeling, it’s important to understand where it comes from. To help unpack the phenomenon, we consulted experts from some of the top- and bottom-ranked states for aggressive driving behavior.
“Road rage is typically less related to the actual traffic conditions than it is to how driving affects an individual's mental state,” explained Brian Lutz, a licensed therapist and the chief clinical officer at Blume Behavioral Health in Redondo Beach, California.
Driving overloads the nervous system with constant surveillance, noise, unpredictability, delay and sensory stimuli, “all contributing to a chronic low-level stress response prior to the occurrence of something ‘negative,’” Lutz said. “By the time another driver cuts you off on the road, your nervous system has likely (already) reached capacity.”
To make matters worse, “aggressive driving can be contagious,” said Carolina Estevez, a clinical psychologist at SOBA New Jersey. “Drivers tend to mimic the level of emotional intensity present in those around them, thus creating a domino effect that can lead to aggressive behaviors escalating in severity very quickly.”
Tips for handling aggressive drivers on the road
Next time you’re in the presence of an aggressive motorist — or feel like you’re at risk of becoming one yourself — keep these tips in mind to stay sane and safe behind the wheel.
- Don’t engage with aggressive drivers. It may be tempting to give a bad driver the stink eye or flip them the bird, but it might just make matters worse. “Avoid eye contact and retaliation,” said Estevez. “Give the driver space and focus on finding a way out instead of trying to win the situation.”
- Give other drivers the benefit of the doubt. It’s easier said than done, but try to pause before identifying other drivers' actions as intentional affronts. Next time someone cuts you off or tailgates, try reframing thoughts like “That person was intentionally trying to disrespect me” to “That person might be distracted or overwhelmed,” Lutz said.
- Remember to breathe. If you feel your stress heating up, you can self-regulate by taking deep breaths, or try counting to 4 as you inhale and 8 while you exhale, recommends Dr. Julia Samton, a psychiatrist at The Midtown Practice in New York. “This activates your body's relaxation response and gives you time to mindfully respond to a stressful situation,” she said.
- Take a moment to cool off — literally. If the environment outside your car is getting you steamed, try changing the environment inside your car. “Listening to soothing music or adjusting the air conditioning or heating system to provide a cooling sensation serves to decrease physiological arousal prior to the escalation of anger,” said Lutz.
And if you’re in a foul mood before getting behind the wheel? Consider staying off the road in the first place.
“Driving while experiencing high levels of anger, anxiety or frustration leads to an increased likelihood of road rage incidents,” Estevez said. Stress chemicals like adrenaline and cortisol don’t just make your heart race; they also impact your judgment and decrease impulse inhibition, she explained.
“It’s important to remember that the ability to regulate emotions behind the wheel is a safety skill, not just a personality trait,” Estevez said.
Methodology
To determine the states with the most road rage, we evaluated all 50 states and Washington, D.C., across six metrics:
- Number of traffic incidents involving gun violence per 100,000 residents over three years (Gun Violence Archive, 2023 to 2025)
- Number of fatal crashes involving aggressive or careless driving per 100,000 residents per year (Fatality Analysis Reporting System, 2024)
- Number of traffic fatalities involving aggressive or careless driving per 100,000 residents per year (Fatality Analysis Reporting System, 2024)
- Percentage of all fatal crashes involving aggressive or careless driving (Fatality Analysis Reporting System, 2024)
- Percentage of all traffic fatalities involving aggressive or careless driving (Fatality Analysis Reporting System, 2024)
- Aggressive/careless driving or speeding violations per 100,000 residents per year (Fatality Analysis Reporting System, 2024)
States were given a score out of 10 for each metric, with 10 going to the state with the highest (worst) value and other states receiving relative scores. We then added together the six metric scores to get a final road rage score. Scores were then normalized to a 100-point scale. A higher score indicates more road rage.
Reference policy
We love it when people share our findings! If you do, please link back to our original article to credit our research.
Questions?
For questions about the data or if you'd like to set up an interview, please contact dedens@consumeraffairs.com.
Article sources
ConsumerAffairs writers primarily rely on government data, industry experts and original research from other reputable publications to inform their work. Specific sources for this article include:
- National Highway Traffic Safety Administration, “NHTSA File Downloads.” Accessed May 26, 2026.
- Gun Violence Archive, “Search Incidents.” Accessed May 26, 2026.
- AAA Foundation for Traffic Safety, “Aggressive Driving and Road Rage.” Accessed May 26, 2026.
- Colorado General Assembly, “SB26-035 Increase of Traffic Violation Penalties.” Accessed May 26, 2026.
- Colorado Governor Jared Polis, “Governor Polis Signs Bills Into Law Reducing Human-Animal Conflicts and Expanding Safe Outdoor Recreation Opportunities.” Accessed May 27, 2026.
- Federal Highway Administration, “Table DL-201.” Accessed May 27, 2026.
- Interview with Matthew Bernarda.
- Interview with Brian Lutz.
Figures