America’s Best Buyer’s and Seller’s Markets, Ranked by ZIP Code

+1 more

Peak homebuying season may bring a nationwide flurry of activity, but the housing market is hardly moving in one direction. In some places, buyers have more room to browse, negotiate and wait. In others, homes are disappearing almost as soon as they hit the market. Increasingly, your negotiating power comes down to your ZIP code. Whether you're a first-time buyer or a seasoned investor, understanding local housing supply and demand is one of the essential steps to buying a house successfully.
To see where buyers or sellers have the upper hand, ConsumerAffairs ranked 6,291 ZIP codes with at least 50 homes sales from April through June 2026 in metro areas with at least 150,000 residents. We used five Redfin housing metrics, including months of housing supply, sale-price-to-list-price ratio, share of homes sold above list price, median days on market and share of listings with price drops, to identify the strongest buyer’s and seller’s markets and the areas in between.
Key insights
Miami is a buyer’s paradise. Its 33130 ZIP code is the nation’s strongest buyer’s market, with 15.5 months of housing supply, roughly triple the national average of 5.1 months.
Jump to insightRochester is the toughest for buyers. Its 14616 ZIP code is the nation’s strongest seller’s market, where 93.9% of homes sell above list price, versus 23.5% nationally.
Jump to insightStrong seller’s markets span price points, from expensive Bay Area ZIP codes to far more affordable Rochester, with tight inventory driving both.
Jump to insightMany of the best buyer’s markets are in the South. The region has 38 of the 50 strongest buyer’s markets, including 21 in Florida. None of the 50 best seller’s markets are in the South.
Jump to insightBalanced ZIP codes typically have four to seven months of supply and sale-to-list ratios between 97% and 98%.
Jump to insightThe five best buyer’s markets by ZIP code
A buyer’s market is characterized by high inventory and weak demand, giving buyers the upper hand in negotiations. In our methodology, ZIP codes with high scores represent areas where homes sit on the market longer and sellers are more likely to cut their asking price to attract interest.
Many of the most buyer-friendly areas in 2026 are in the Southern U.S. Of the 50 most buyer-friendly ZIP codes, 38 are in the South, and 21 are in Florida.
"The South has built more homes in recent years, and now there are more properties available as demand has cooled from the pandemic boom," said Nadia Evangelou, principal economist and director of real estate research at the National Association of Realtors. "That gives buyers more choices and more room to negotiate. Florida is probably the best example of that shift."
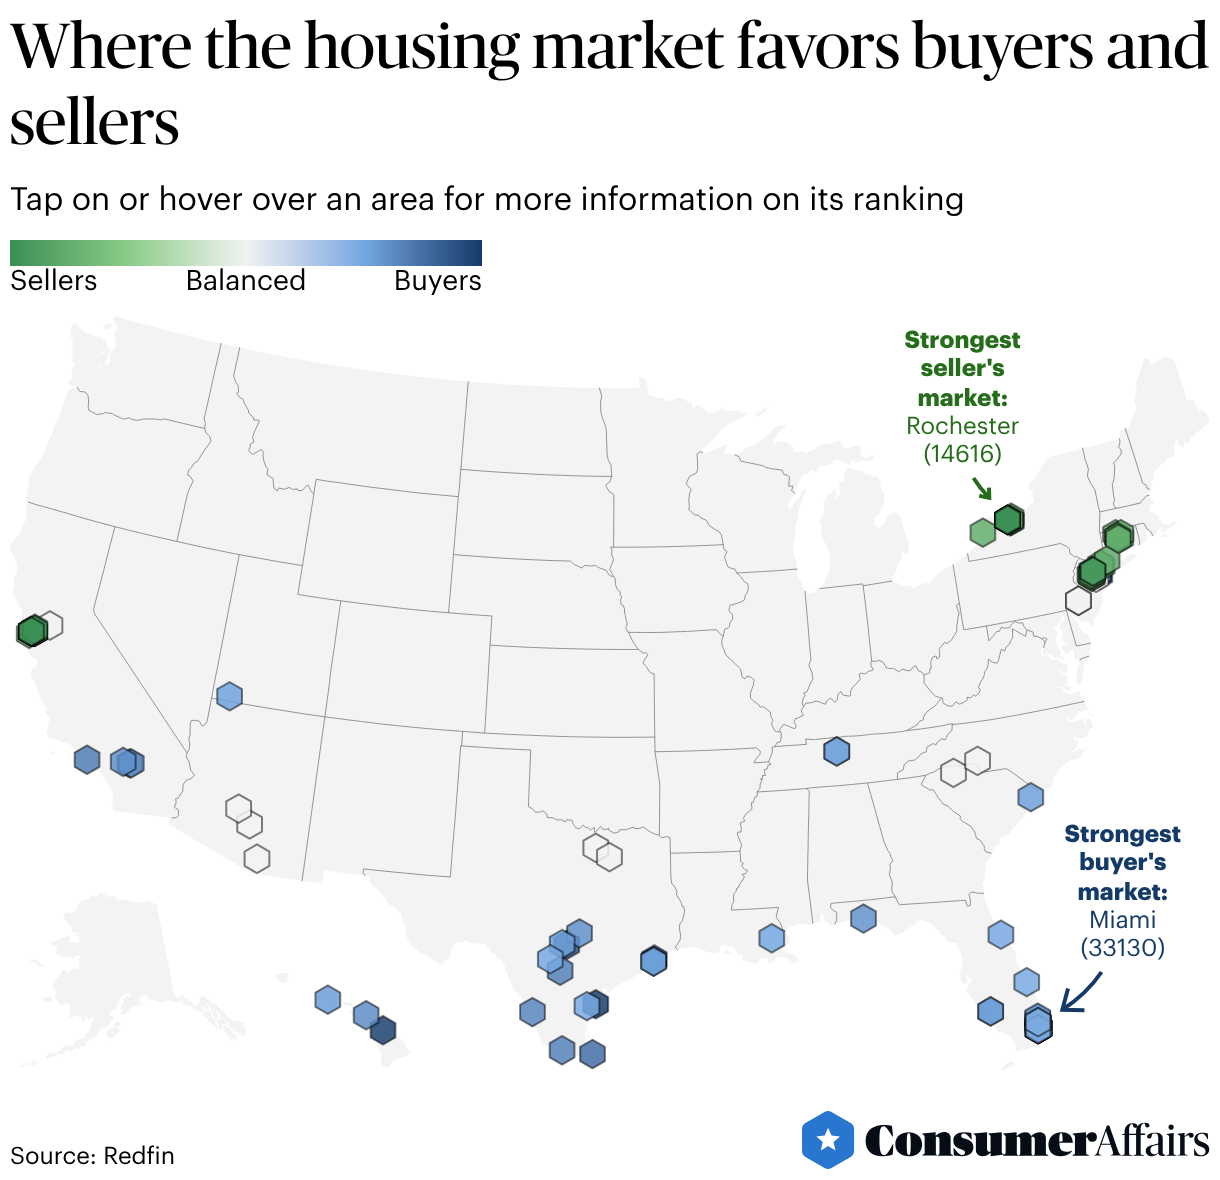
The map below shows the 50 best buyer’s markets, the 50 best seller’s markets and the most balanced markets in our analysis.
1. Miami, Florida (33130)
77.02 out of 100 points
Miami's 33130 ZIP code, which includes parts of Brickell and Little Havana, is the nation's strongest buyer's market. The number of months of supply, at 15.5, is three times the national average of 5.1 months. Put simply, if no new homes came onto the market, it would take more than a year to sell through the existing inventory at the current pace.
The condo-heavy market helps explain the imbalance. Across Miami-Dade County, condo inventory currently sits at 12.3 months of supply, a sharp contrast with the more competitive single-family market supply of 4.9 months, according to the Miami Association of Realtors. Financing presents another hurdle: fewer than 1% of South Florida condo buildings are approved for FHA loans, while stricter federal lending standards have made traditional financing more difficult for some buyers. Over half of existing Miami condo sales involve financing.
David Freed, a Miami real estate agent who works in Brickell, said the market figures reflect his recent experience. "More than half of my buyers are getting a price reduction," Freed told ConsumerAffairs. He said the area has shifted from a seller's market a few years ago to one where "the ball is in the buyer's court now."
New construction is also going up faster than would-be owners are buying. Freed said many newcomers rent first while they get to know Miami, even as more housing is added. "The housing inventory appears to be building faster ... than the amount of people that are moving here to purchase," he said.
- Months of supply: 15.5 (sixth highest)
- Average sale-to-list ratio: 95%
- Share of homes sold above list price: 0% (lowest)
- Share of listings with price drops: 29.4%
- Median days on market: 158 (seventh highest)
2. Port Aransas, Texas (78373)
76.59 out of 100 points
Port Aransas, located on a barrier island on the Gulf Coast of Texas, is the second-strongest buyer's market in the country. It has the highest months of supply (18.3) of any ZIP code in our analysis, and one of the lowest percentages of sales that go for above the asking price (1%). The stats suggest that in addition to being a hot destination for tourists from Texas cities like San Antonio and Austin, Port A, as it’s known, is a highly favorable environment for homebuyers.
- Months of supply: 18.3 (highest)
- Average sale-to-list ratio: 95%
- Share of homes sold above list price: 1%
- Share of listings with price drops: 38.0%
- Median days on market: 76
3. Lahaina, Hawaii (96761)
76.22 out of 100 points
Lahaina and the northwest coast of Maui make up the only Western ZIP code — and the only non-Southern location — in the top five buyer’s markets. The area continues to recover three years after the deadliest wildfires in U.S. history destroyed hundreds of homes. It ranks in the top 100 in four of the five metrics we analyzed, including third in median days on market (171) and 10th in months of supply (14.2).
- Months of supply: 14.2 (10th highest)
- Average sale-to-list ratio: 93%
- Share of homes sold above list price: 2.3%
- Share of listings with price drops: 28.7%
- Median days on market: 171 (third highest)
4. Miami, Florida (33132)
75.90 out of 100 points
This Miami area, which includes the downtown waterfront on Biscayne Bay, is the fourth-best buyer’s market in the U.S. It shares much in common with the No. 1-ranked buyer’s market on our list, ZIP code 33130, 2 miles away, where most listings are condos that sit on the market for weeks. Experts attribute the imbalance of supply and demand in South Florida to multiple factors, including new building inspection requirements that have raised costs for some owners, prompting many to sell.
- Months of supply: 15.3 (seventh highest)
- Average sale-to-list ratio: 95%
- Share of homes sold above list price: 0.8%
- Share of listings with price drops: 25.3%
- Median days on market: 157 (ninth highest)
5. North Miami Beach, Florida (33160)
75.00 out of 100 points
Rounding out the Florida-heavy top five is the 33160 ZIP code, which includes parts of North Miami Beach and Aventura, as well as Sunny Isles Beach and Golden Beach, two oceanfront communities on a barrier island next to the Intracoastal Waterway. Homes there, which are overwhelmingly condos, are selling for an average of 7% below the list price — the biggest discount among the top five buyer’s markets.
- Months of supply: 13.6 (13th highest)
- Average sale-to-list ratio: 93%
- Share of homes sold above list price: 2.7%
- Share of listings with price drops: 32.3%
- Median days on market: 160 (fifth highest)
The five strongest seller’s markets by ZIP code
At the other end of the spectrum, a seller's market emerges when demand far outpaces housing supply, often leading to bidding wars and quick sales. Expensive locations in the Bay Area may be familiar examples, but this year's ranking shows that the same dynamic can play out in far more affordable places, including Rochester, New York. It’s a reminder that a hot market isn't necessarily an expensive one; what matters is the relationship between the number of homes available and the buyers competing for them.
1. Rochester, New York (14616)
3.13 out of 100 points
The 14616 ZIP code, about 5 miles northwest of downtown and covering part of the town of Greece, is, by our calculation, the strongest seller’s market in the U.S. Homes for sale last a median of only eight days, and there’s less than one month’s worth of supply. (Under 2% of the ZIP codes in our analysis have less than one month of housing supply.)
That shortage is beneficial for sellers’ pockets: 93.9% of homes sell above list price, the highest rate nationwide. In other words, Rochester shows that an approachable price tag — the median new list price is just over $193,000 — doesn't necessarily make for an approachable housing market.
According to Redfin, competition for housing in upstate New York has been hot for several years for a combination of reasons, including relative affordability, its economic renewal and a smaller and aging housing stock.
Evangelou, from NAR, said Rochester illustrates why price alone is a poor measure of market heat. “Inventory has improved over the last couple of years, but it’s still just over half of what it was before the pandemic,” she said.
- Months of supply: 0.7
- Average sale-to-list ratio: 128% (fourth highest)
- Share of homes sold above list price: 93.9% (highest)
- Share of listings with price drops: 6.6%
- Median days on market: 8
2. San Francisco, California (94122)
3.30 out of 100 points
San Francisco's 94122 ZIP code, featuring the Sunset District and the southern part of Golden Gate Park, is the country's second-strongest seller's market. Despite a median list price of $1.9 million (338% above the U.S. median), homes sell in a median of two weeks, and there’s less than a half-month of supply. Buyers who do manage to close on one of the pastel-painted, stucco houses in this western part of The City pay an average of 31% above the asking price, the highest in America.
- Months of supply: 0.4 (sixth lowest)
- Average sale-to-list ratio: 131% (highest)
- Share of homes sold above list price: 86.8% (11th highest)
- Share of listings with price drops: 5.0% (eighth lowest)
- Median days on market: 14
3. Berkeley, California (94708)
4.30 out of 100 points
Homes in the winding roads of the Berkeley Hills, with some of the best panoramic views of the San Francisco skyline, the Golden Gate Bridge, Alcatraz and the fog, are not easy to come by. These geographic amenities, the lack of available land for new construction and low turnover mean that at any given time, there may be only a few dozen active listings. Sellers can count on plenty of flush buyers putting in cash offers; over 90% of homes sell above the list price, and the average sale-to-list ratio is 129% — both are third highest in the U.S.
- Months of supply: 0.7
- Average sale-to-list ratio: 129% (third highest)
- Share of homes sold above list price: 90.6% (third highest)
- Share of listings with price drops: 6.7%
- Median days on market: 15
4. San Francisco, California (94116)
4.86 out of 100 points
Families in the Parkside neighborhood of San Francisco aren’t just within walking distance of strong schools, Ocean Beach and the zoo — they reside in the country’s fourth-best seller’s market. The average home in the area sells for 30% above the list price, second only to the ZIP code directly north, which ranks No. 2 overall. The artificial intelligence boom and an inventory shortage have led prices higher throughout San Francisco in 2026, according to the California Association of Realtors.
- Months of supply: 0.4 (sixth lowest)
- Average sale-to-list ratio: 130.0% (second highest)
- Share of homes sold above list price: 82.6%
- Share of listings with price drops: 6.6%
- Median days on market: 13
5. Rochester, New York (14617)
5.40 out of 100 points
The Rochester housing market’s competitiveness is not limited to just one ZIP code: This area, bounded by the Genesee River to the west and Lake Ontario to the north, and including part of the suburb of Irondequoit, ranks as the fifth strongest for sellers.
Homes here move faster than in any of the top five seller’s markets, at a median of just seven days, and 90.5% of homes sell above asking price, the fourth-highest percentage in the U.S. The average home seller gets 25% above list price for their property.
- Months of supply: 0.8
- Average sale-to-list ratio: 125% (eighth highest)
- Share of homes sold above list price: 90.5% (fourth highest)
- Share of listings with price drops: 8.0%
- Median days on market: 7
Where are the most balanced housing markets?
If a local housing market is a tug-of-war, a balanced market is where buyers and sellers are pulling with roughly equal force and neither side has a clear advantage in negotiations. In our scoring system, a score of 50 out of 100 best represents the midpoint between buyer and seller friendliness.
The data shows that these balanced ZIP codes have around four to seven months of housing supply and sale-to-list ratios near 97% to 98%, meaning the average home sells just below the list price. The share of homes selling above list price is below the national average of 23.5%, and the percentage of listings that undergo price drops is mostly above the U.S. average of 31.6%. The median number of days on market is variable, ranging from 40 to 83.
These balanced ZIP codes are also geographically diverse, covering all regions except the Midwest.
The following ZIP codes are essentially balanced between buyer- and seller-friendly conditions:
- Coolidge, Arizona (85228)
- Denton, Texas (76208)
- Staten Island, New York (10301)
- Philadelphia, Pennsylvania (19123 and 19134)
- Spartanburg, South Carolina (29302)
- Green Valley, Arizona (85614)
- Rio Vista, California (94571)
- Rowlett, Texas (75089)
- Charlotte, North Carolina (28206)
- Phoenix, Arizona (85014)
Methodology
The ConsumerAffairs Research Team analyzed data from 6,291 U.S. ZIP codes to determine where homebuyers and sellers have the most negotiating power. We looked at five housing market metrics from Redfin’s Data Center for the period of April through June of 2026.
Each ZIP code was scored on every metric based on how favorable conditions are for buyers. The most buyer-friendly ZIP code received the maximum number of points available for that metric, while the most seller-friendly received a score of zero. All other ZIP codes were scored proportionally. Weighted scores were then combined for a final score out of 100 points.
Higher scores indicate stronger buyer’s markets, while lower scores indicate stronger seller’s markets. ZIP codes scoring closest to 50 were considered the most balanced.
Months of supply (30 points)
The number of months it would take to sell all available inventory at the current sales pace. Higher numbers favor buyers, while lower numbers favor sellers.
Average sale-to-list ratio (20 points)
On average, what percentage of the asking price a home is selling for. Ratios below 100% favor buyers, while ratios above 100% favor sellers.
Share of homes sold above list price (20 points)
The percentage of homes sold above the list price. Lower percentages favor buyers, while higher percentages favor sellers.
Median days on market (15 points)
The median number of days between a home being listed and going under contract. Longer times favor buyers, while shorter times favor sellers.
Share of listings with price drops (15 points)
The percentage of active listings that had at least one price reduction. Higher percentages favor buyers, while lower percentages favor sellers.
We limited our analysis to ZIP codes with at least 50 home sales from April through June 2026 in metro areas with at least 150,000 residents. This helped reduce volatility associated with lower-volume markets. Redfin data may be incomplete or unavailable in some areas. Rankings reflect conditions during the study period and may change over time.
Reference policy
We love it when people share our findings! If you do, please link back to our original article to credit our research.
Questions?
For questions about the data or if you'd like to set up an interview, please contact egomes@consumeraffairs.com.
Article sources
ConsumerAffairs writers primarily rely on government data, industry experts and original research from other reputable publications to inform their work. Specific sources for this article include:
- Redfin, "Redfin Data Center Download Hub." Accessed Aug. 14, 2026.
- Miami Association of Realtors, "Miami-Dade Real Estate Posts Best June in Three Years; Home Sales Rise for 10th Consecutive Month." Accessed Aug. 14, 2026.
- The New York Times, “Spike in Florida Condo Supply Is Creating a Buyers’ Market.” Accessed Aug. 14, 2026.
- Redfin, “Western New York Is the Most Competitive Place to Buy a Home in America.” Accessed Aug. 14, 2026.
- California Association of Realtors, "June Home Sales and Price Report." Accessed Aug. 14, 2026.
Figures