Home Invasion Statistics by State 2026
+2 more

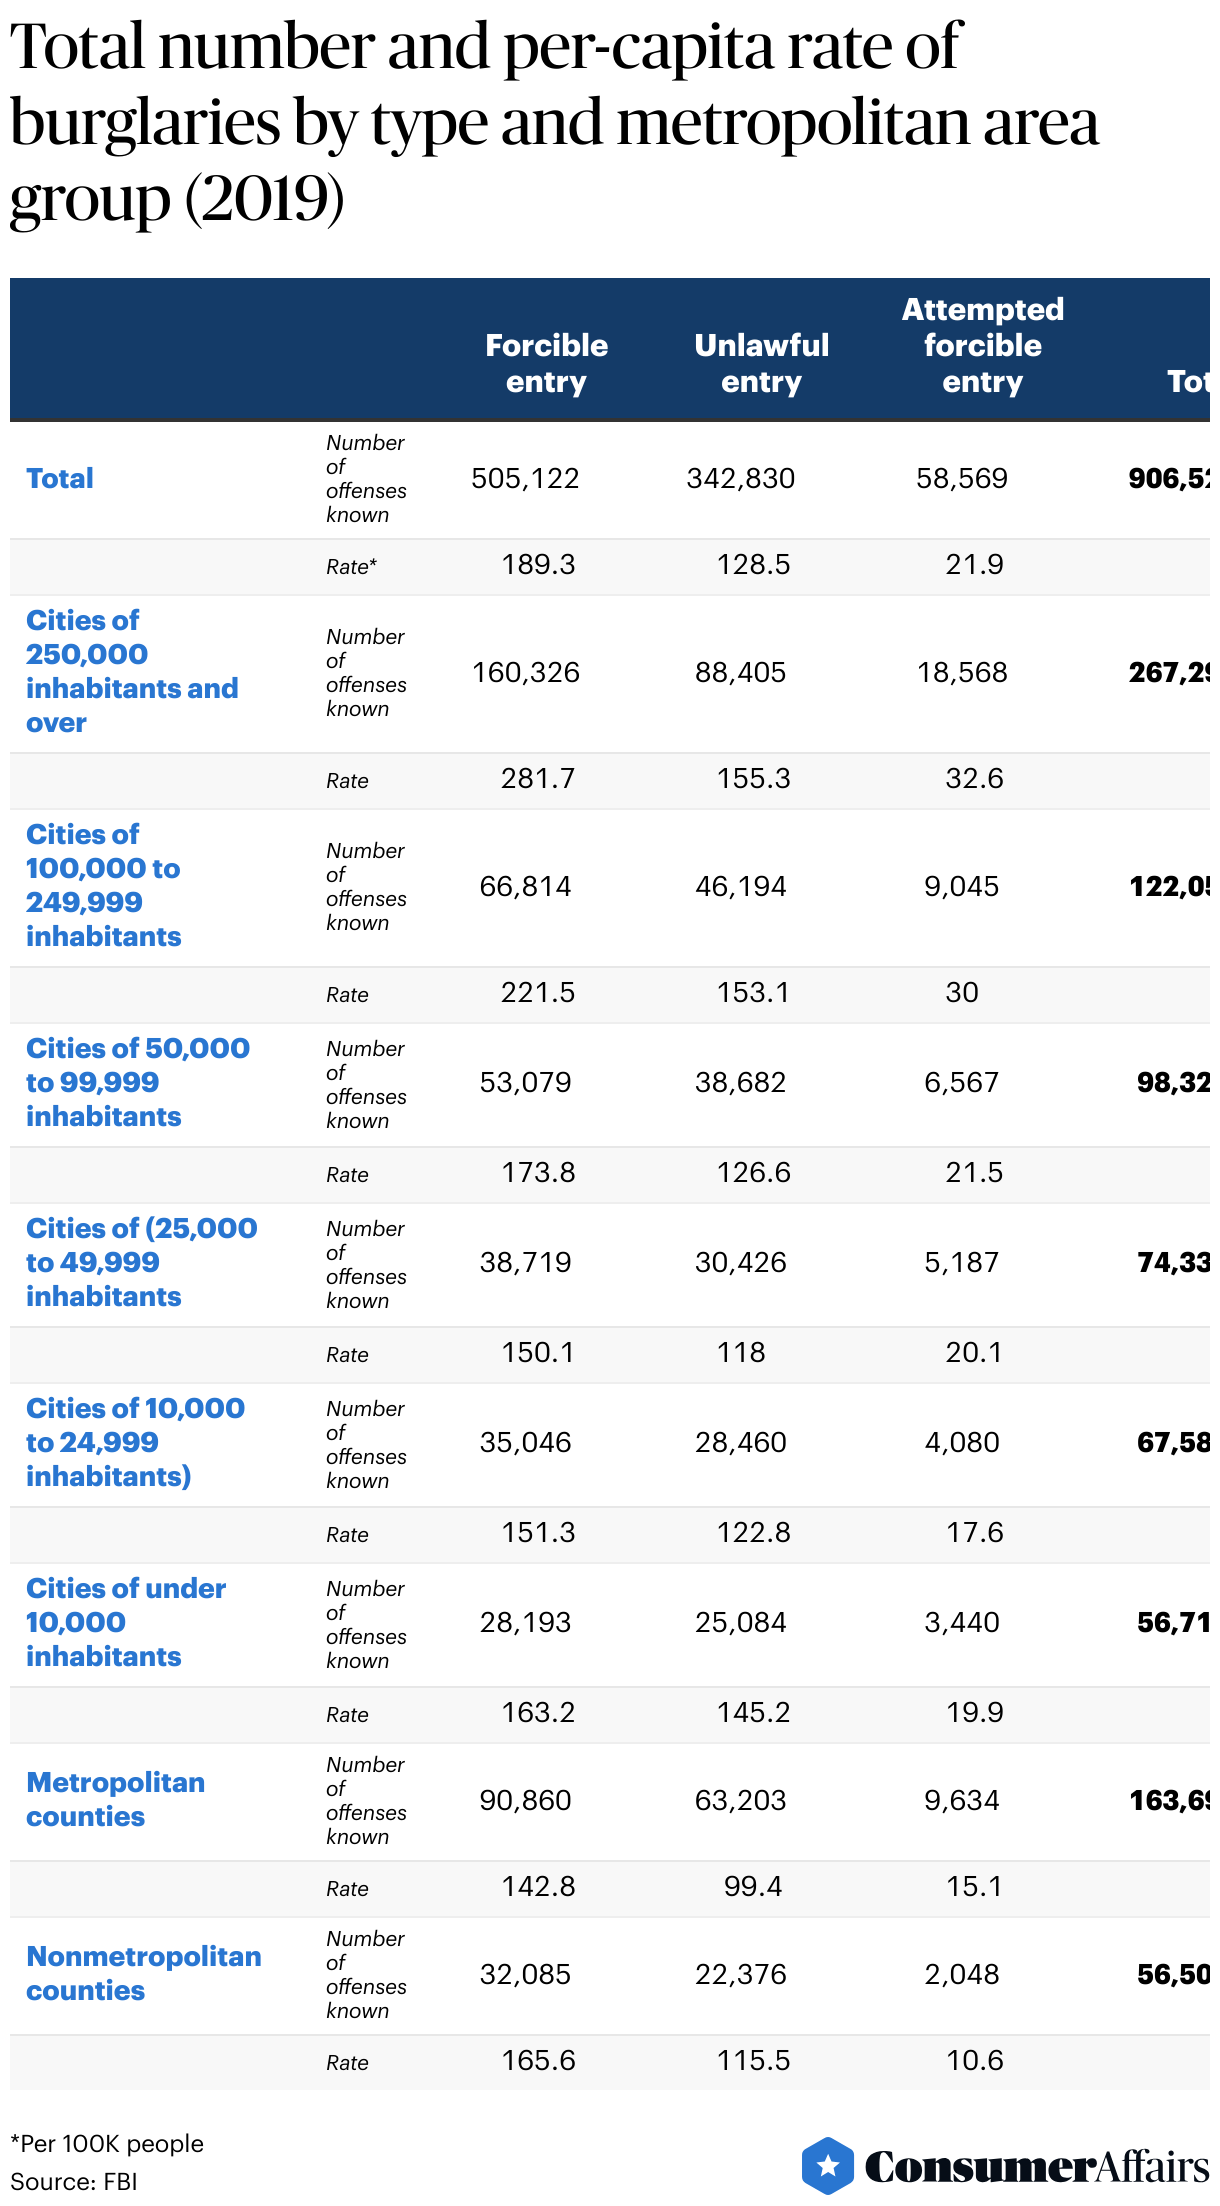
Home invasions, or burglaries, have been declining over the past thirty years. Forcible entry is the most common type of home invasion, accounting for 55.7% of all incidents, followed by unlawful entry at 37.8%. Major cities with more than 250,000 people have the highest percentage of forcible entry and unlawful entry.
Burglars tend to enter homes more often during the daytime than at night. Homeowners can take steps to safeguard their homes against burglars, including installing alarm systems and securing window locks and deadbolts on all entry points. One can also set timers, maintain outdoor appearance and clear all mail from the outside the home to appear as though someone is home.
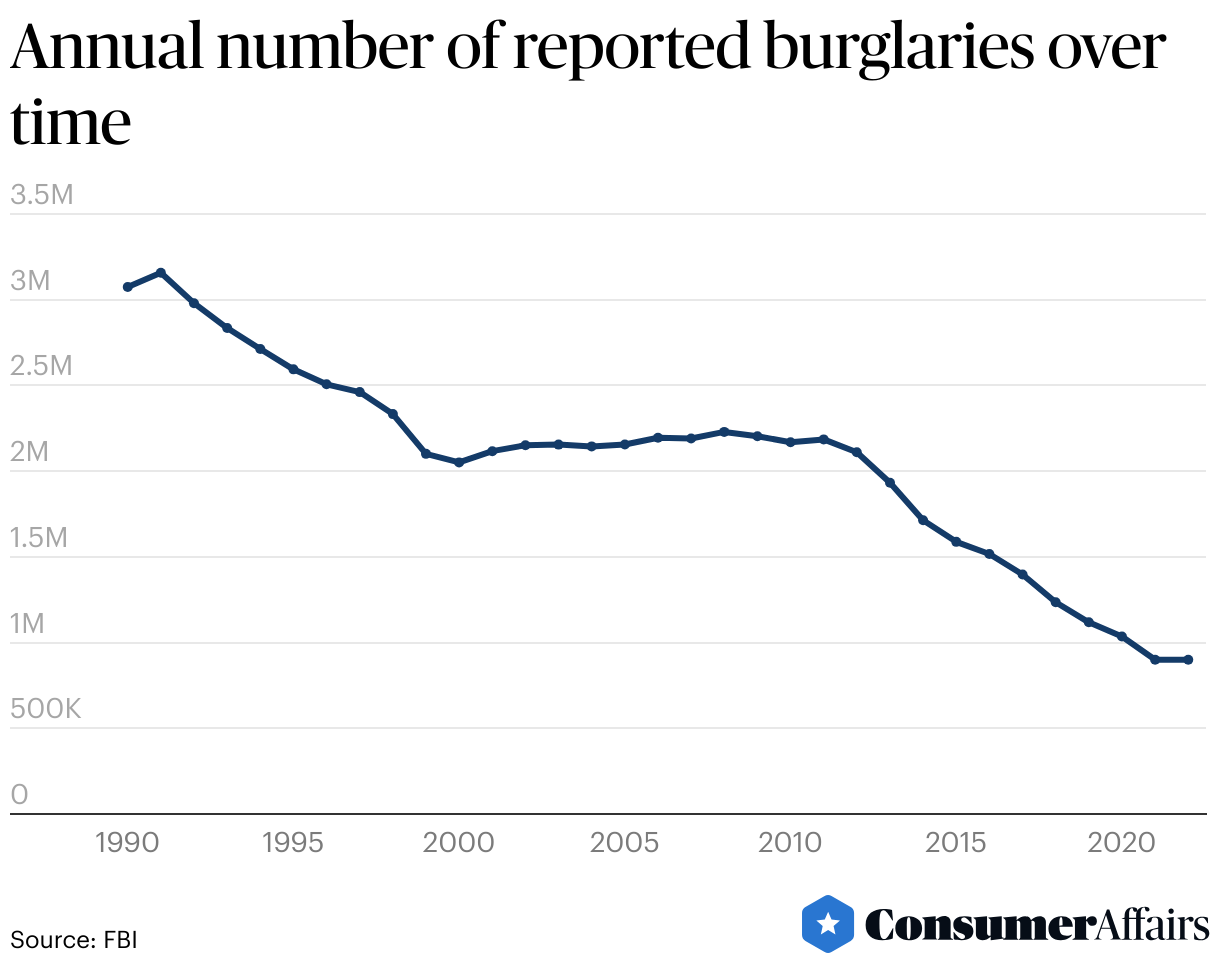
Burglary rates are declining according to the Federal Bureau of Investigation (FBI) Uniform Crime Reporting (UCR) Program. Since 2012, the number of burglaries declined by 57.4% from 2,109,932 reported cases that year to 899,293 cases in 2022. As of 2025, the burglary rate has declined by 11.9% from 2024.
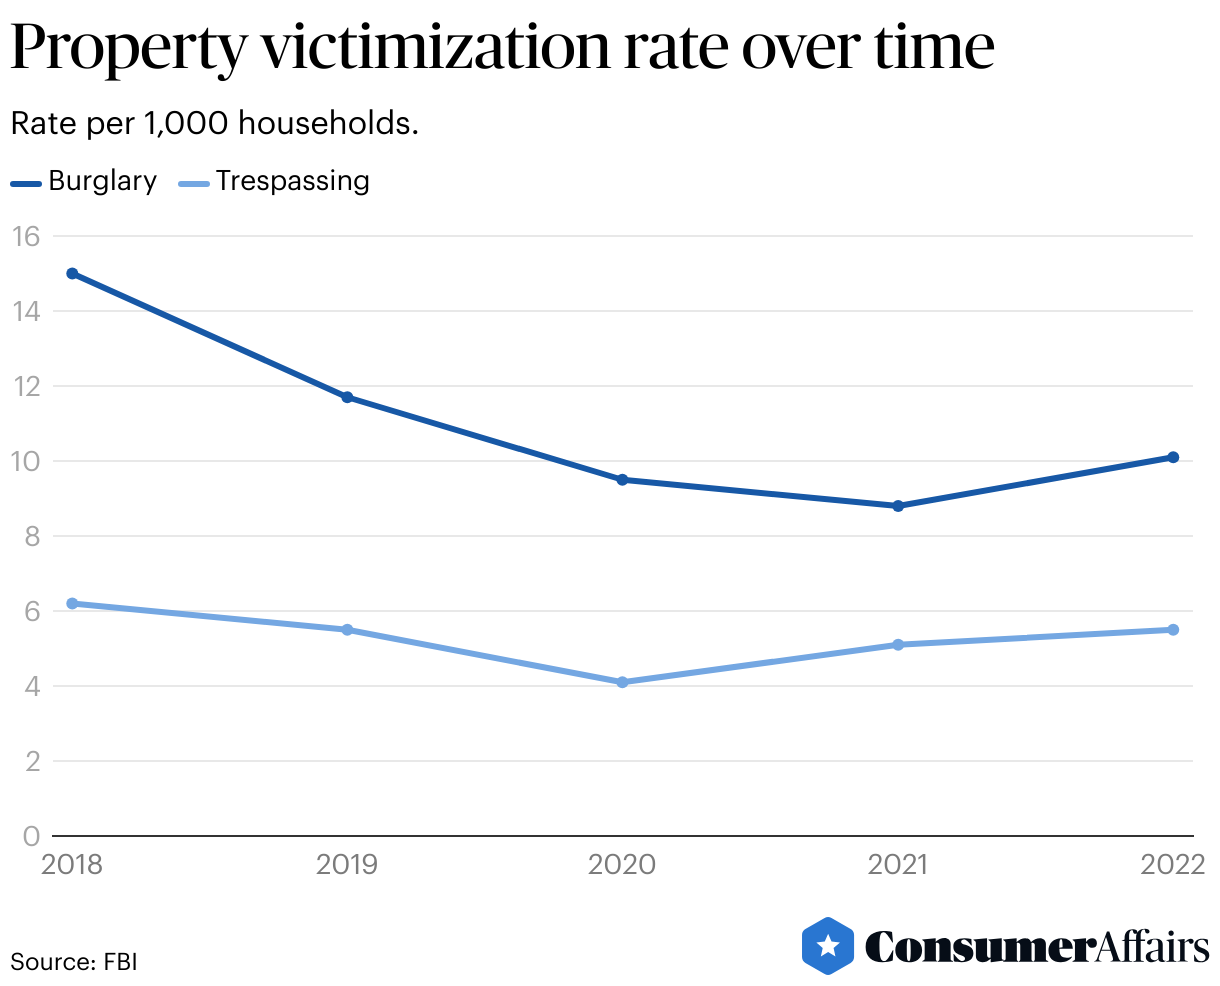
Jump to insightThe rate of property victimization — the rate at which persons of a household were victims of a crime — has generally decreased from 2018 to 2022. Burglary figures, specifically, have dropped from 15.0 per 1,000 households in 2018 to 9 per 1,000 households in 2023.
Jump to insightBurglaries can result in significant property loss. The average dollar loss per burglary offense for a residence in 2022 was over $97,000, according to the FBI.
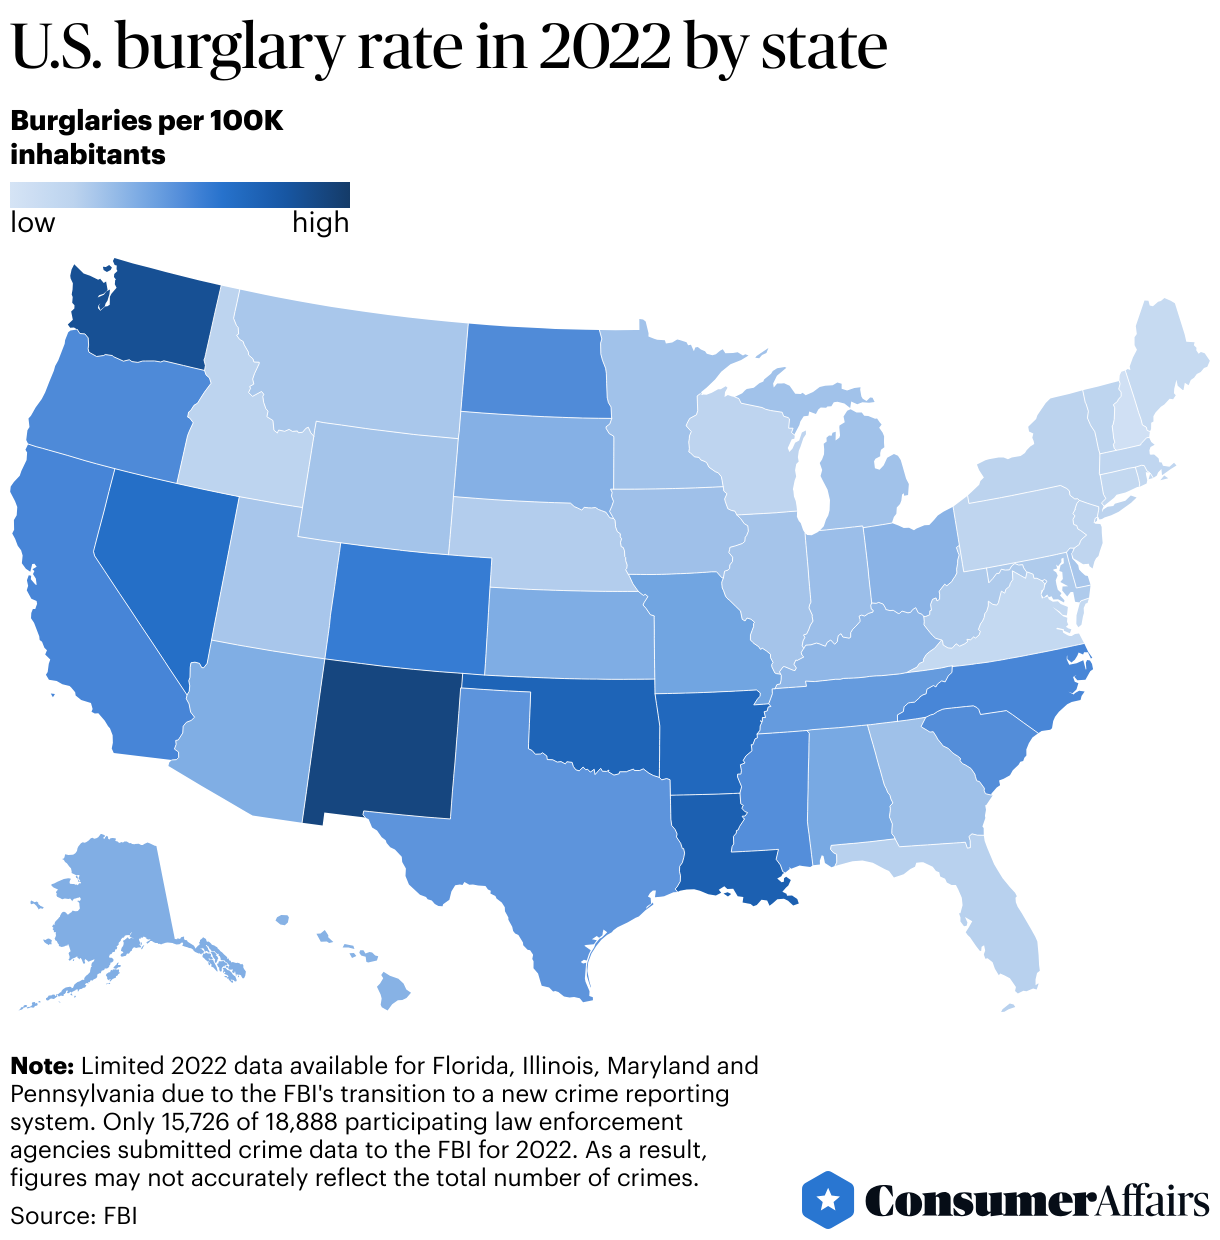
Jump to insightThe state with the highest burglary rate in 2022 was New Mexico, and the state with the lowest burglary rate was New Hampshire.
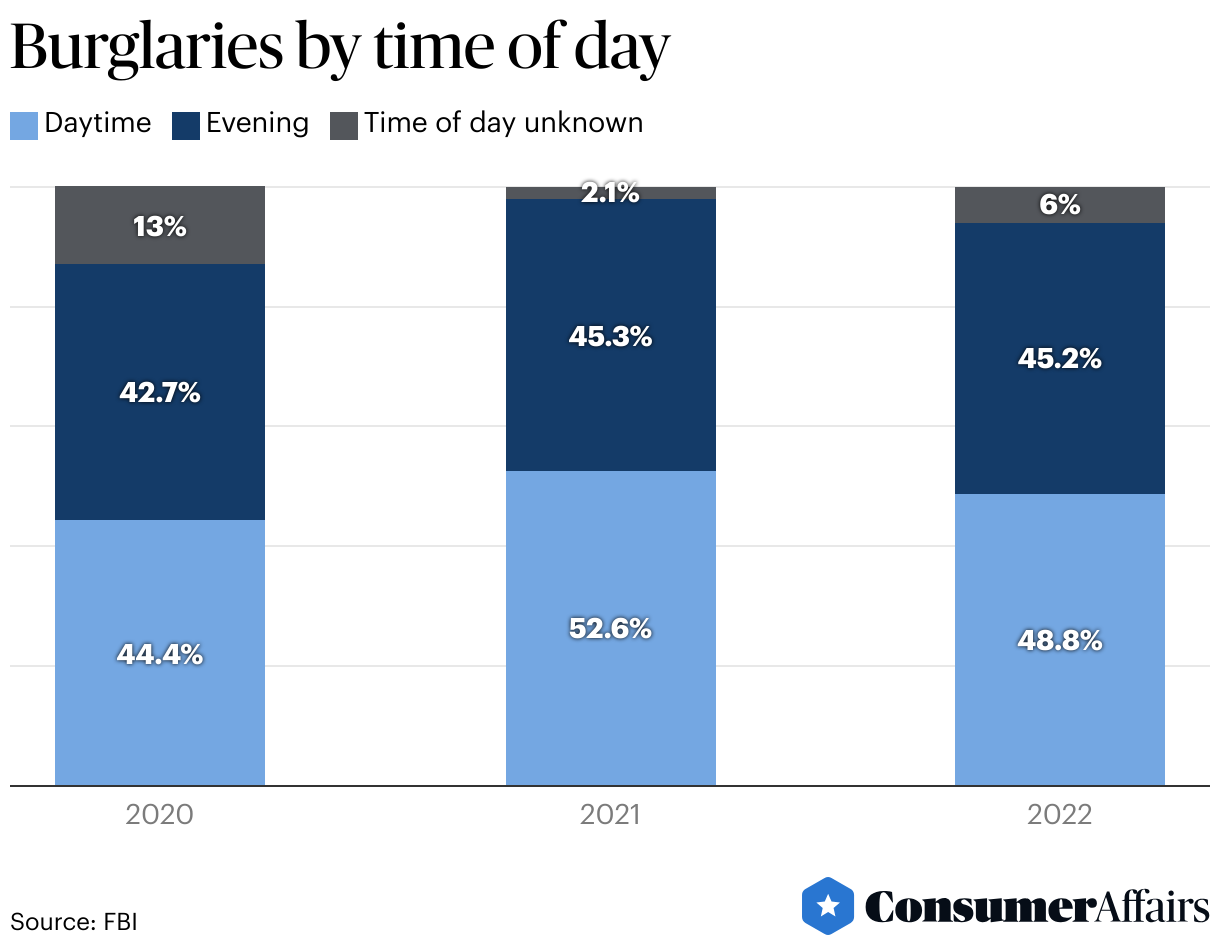
Jump to insightBurglars strike more often during the daytime, according to FBI data. Of the total burglaries in 2022, 48.8% of total residence and nonresidence burglaries occurred during the day, compared with 45.2% that occurred at night.
Jump to insightGeneral home invasion statistics
The National Crime Victimization Survey (NCVS) provides detailed estimates of nonfatal violent and property crime. For example, if a victim suffers violence during a burglary, these are classified among victimization rates, which measure the extent to which violent and property victimizations occurred in a specific population during a specified time.
The burglary-related victimization rate has declined from 2018 to 2023, from 15.0 to 9 per 1,000 households, respectively.
Burglaries can lead to significant property loss. According to FBI data, in 2023, the average value of stolen property for residences totaled over $5,035 for items taken both during the day and at night.
The below table shows the average value of stolen property by location and time of day in 2023.
| Location | Value of stolen property |
|---|---|
| Residence, day | $5,018 |
| Residence, night | $4,488 |
| Residence, unknown | $8,327 |
| Nonresidence, day | $4,889 |
| Nonresidence, night | $4,827 |
| Nonresidence, unknown | $11,385 |
Burglary rate trends
The number of reported burglaries has been declining since 2012. Over the years between then and 2022, the number of burglaries declined by 57.4% — 2,109,932 reported cases in 2012 to 899,293 in 2022. Looking at figures from over thirty years ago, burglaries declined by 70.4% from the 3,073,909 burglaries reported in 1990. As of 2025, the burglary rate has declined by 11.9% from the previous year.
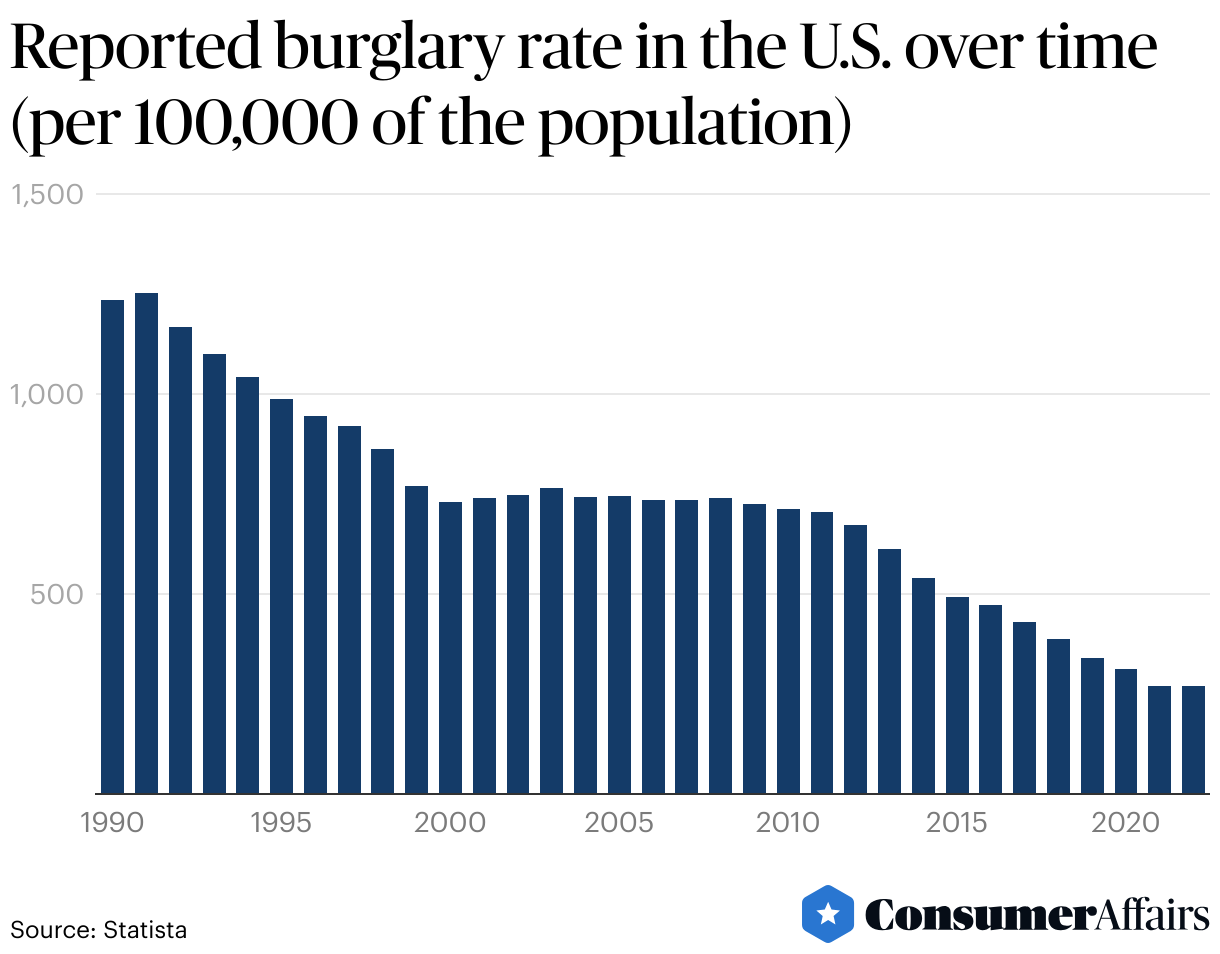
Despite a few upticks, the burglary rate has generally been on a decreasing trend since 1990. In 1990, the per-capita rate (1,235.9 per 100,000 people) was over 4.5 times higher than in 2022 (269.8 per 100,000 people). In the U.S. in 2022, per-capita national burglary incidents were nearly identical to 2021 (270.9 per 100,000 people), and in 2024, it dropped to the lowest rate since 2005: 229.2.
Burglary rate by state
In 2024, the overall per-capita burglary rate in the U.S. was 229.2 per 100,000 people. The three states with the highest burglary rates were New Mexico (500), Oklahoma (411) and Louisiana (405). The lowest were New Hampshire (48), Rhode Island (91) and Maine (100).
Which break-ins are most common?
The FBI’s UCR Program defines a burglary as the unlawful entry of a structure to commit a felony or theft. It provides three subclassifications for the crime: forcible entry, unlawful entry where no force is used and attempted forcible entry. Of the three, forcible entry was the most common, accounting for 55.7% of all burglaries in 2019, followed by unlawful entry (37.8%).
Large cities with populations over 250,000 people had the highest rates of forcible entry of all city sizes and counties, totaling 60%. The rate per population size was also the highest, averaging 281.7 burglaries per 100,000 inhabitants.
When do burglaries occur most?
By a slight margin, more burglaries happen in the daytime than at night, according to FBI data. In 2024, 46.4% of total residence and nonresidence burglaries occurred during the day compared to 49.7% occurring at night. This was a decrease from 48.8% of daytime burglaries in 2022. Looking at only residential burglaries in 2024, 53.4% took place during the daytime, while 42.9% were perpetrated at night.
How to deter burglaries
There are three steps that you can take to deter burglars. First, install an alarm system and camera or video doorbell. According to a University of North Carolina study, around 60% of respondents would be deterred by an alarm and would seek another target. Second, ensure that all windows are secured with high-quality locks and doors with deadbolts.
According to recent FBI data, 55.7% of break-ins involve forcible entry, so fortify all entry points. Lastly, make sure that your home looks occupied. For example, put lights on a timer, maintain the lawn, hire a housesitter and ensure that mail and newspapers are paused when you are away.
FAQ
Does homeowners insurance cover home invasions?
Yes. Homeowners insurance covers your home and personal property in the event that your home is broken into. This includes replacing the stolen items and the damage to your home. The coverage depends on your plan. There are two types of personal property coverage: replacement cost and actual cash value (ACV). With replacement cost, your insurer will pay to replace your stolen goods with new items, no matter how long you owned them. With ACV, the insurer pays an item’s actual worth after years of use.
What is the No. 1 top investment to deter a burglar?
According to home security company ADT, an outdoor security camera is the best deterrent for burglars, as it instills the risk of being caught, identified and convicted via security camera.
How can I protect my home when I am on vacation?
When on vacation, use timers for lights; ask friends to pick up mail and newspapers or have the services paused; secure doors and windows before leaving; check your security system while away and leave your car in the driveway to help protect your home from potential burglaries.
Article sources
ConsumerAffairs writers primarily rely on government data, industry experts, and original research from other reputable publications to inform their work. Specific sources for this article include:
- Federal Bureau of Investigation, Criminal Justice Information Services Division, "Crime Data Explorer." Accessed Oct. 27, 2025.
- Statista, "Reported burglary rate in the United States from 1990 to 2023 (per 100,000 of the population)." Accessed Oct. 27, 2025.
- Statista, "Burglary rate by state U.S. 2023." Accessed Oct. 27, 2025.
- Federal Bureau of Investigation, "2019 Crime in the United States: Burglary." Accessed Oct. 27, 2025.
- Federal Bureau of Investigation, "FBI Crime Data Explorer: National Data." Accessed Oct. 27, 2025.
- U.S. Department of Justice, Office of Justice Programs, Bureau of Justice Statistics, "Victimization During Household Burglary." Accessed Oct. 27, 2025.
- Federal Bureau of Investigation, "FBI – Table 23." Accessed Oct. 27, 2025.
- Bureau of Justice Statistics, U.S. Department of Justice, "Criminal Victimization, 2022." Accessed Oct. 27, 2025.
- Federal Bureau of Investigation, "Table – 19." Accessed Oct. 27, 2025.
- ADT, "The Top 10 Burglar Deterrents in 2022." Accessed Oct. 27, 2025.
- Council on Criminal Justice, "Crime Trends in U.S. Cities." Accessed Oct. 27, 2025.
- Statista, "Average value of property stolen during burglaries in the United States in 2023, by location (in U.S. dollars)." Accessed Oct. 27, 2025.
- U.S. Department of Justice, Office of Justice Programs, Bureau of Justice Statistics, "Criminal Victimization, 2023." Accessed Oct. 27, 2025.
- SafeHome.org, "The Latest Burglary Statistics: How Common is Burglary in the U.S.? | SafeHome.org." Accessed Oct. 27, 2025.
Figures