Zoomers to boomers: Which generation has the worst drivers?
+1 more

Driver safety isn’t just about your own behavior behind the wheel. To protect your car (and your passengers), you’re counting on everyone else on the road to do their part, too.
When you’re in the driver’s seat, would you feel safer sharing the road with someone who can’t remember a world before the internet or one who can recall landing on the moon?
Assumptions about age and driving behavior are all over the map, but the data paints a more straightforward picture. To determine which age group has the worst drivers, the ConsumerAffairs Research Team analyzed the latest fatal crash data from the National Highway Traffic Safety Administration (NHTSA), focusing on deadly crashes linked to risky driving behaviors. Read on to find out how your generation compares.
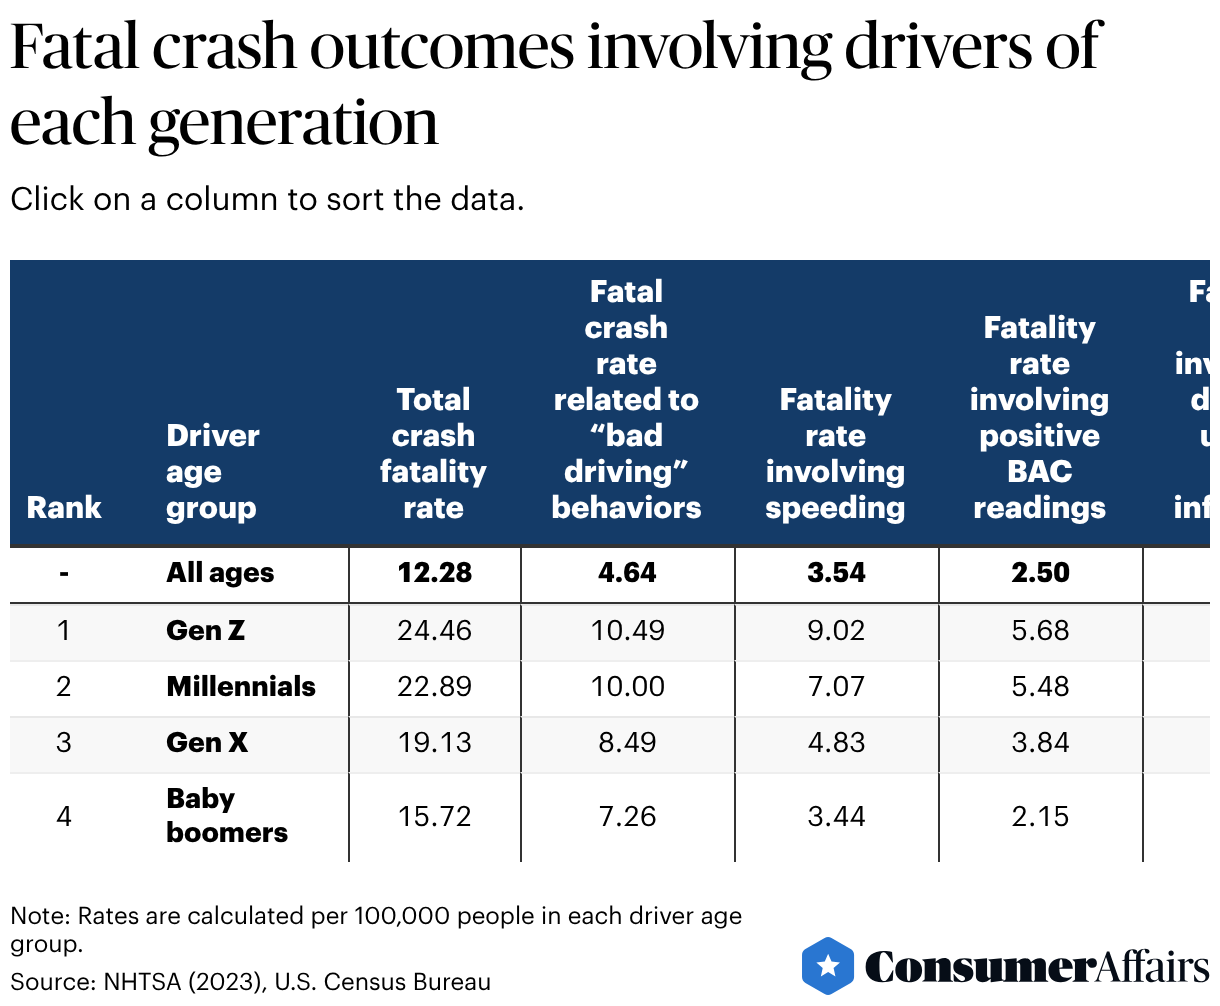
Gen Z drivers are the worst generation for safe driving. Their involvement in crash fatalities is two times higher than the national average.
Jump to insightMillennials aren’t far behind — they’re nearly tied with Gen Z for the highest fatal crash rates caused by bad driving behavior.
Jump to insightGen X falls in the middle of the pack, though all of its crash metrics are higher than the national averages.
Jump to insightBaby boomers rank as the safest drivers overall, with the lowest fatal crash and traffic death rates of all generations. Several of their crash metrics are below average.
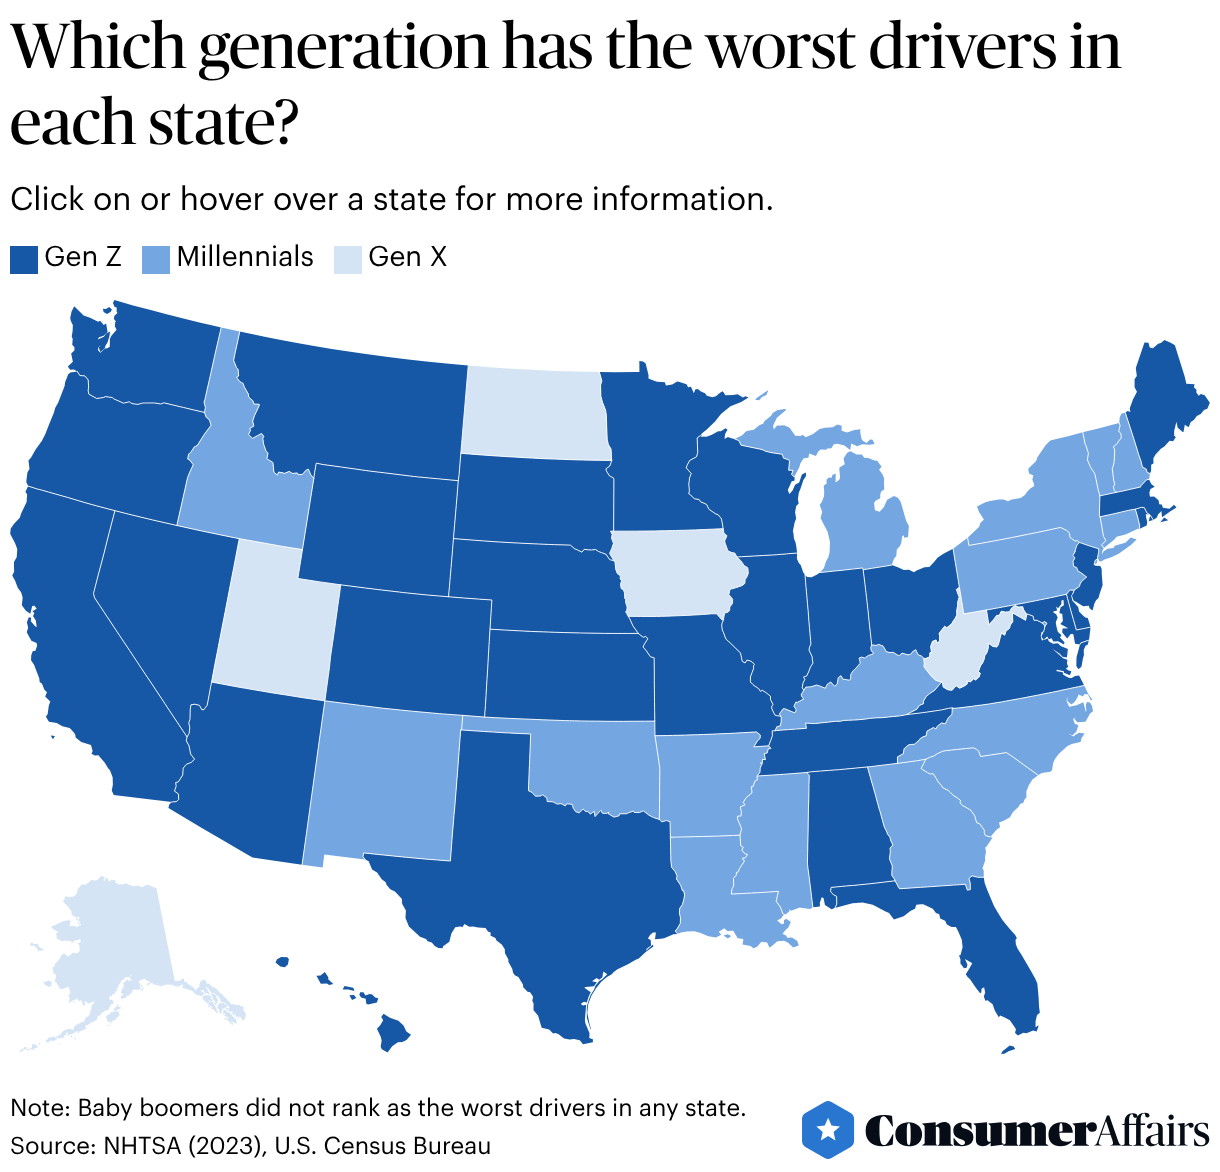
Jump to insightGen Z is the most reckless generation in 29 states, while baby boomers don’t rank worst in any state.
Jump to insightWhich generation is the most dangerous behind the wheel?
Drivers and nondrivers alike often debate who are the safest motorists. Some people think the most reckless road users are Millennials or Generation Zers, who have fewer years of driving experience and may be more prone to distracted driving. However, others argue that senior drivers are more likely to exhibit poor driving behavior due to age-related challenges. (In fact, three in four drivers support retesting drivers older than 70, according to our 2025 survey.)
While people make all manner of assumptions about the relationship between a driver’s age and their abilities behind the wheel, the crash data tells a clearer story: Crash rates are far higher in the younger generations.
Check out the data table below to see which generation has the worst drivers — and where their impact is most felt.
1. Gen Z (15 to 29 years old)
The kids aren’t all right: Of all the generations who share the road, Gen Z drivers are the least safe. They’re involved in crash fatalities at twice the national rate.
Gen Zers make up about one-fifth of the U.S. population, but they are involved in 45% of all fatal crashes attributable to bad driving behaviors.
In a closer look at the data, the “Zoomer” nickname takes on a tragic new resonance: Speeding is one of the top causes of crash fatalities involving Gen Z drivers. Nearly 6,000 motorists were killed in crashes due to speeding by drivers in Gen Z in 2023. That’s 9.02 deaths per 100,000 Gen Zers, more than two and a half times the national rate.
2. Millennials (30 to 44 years old)
Millennials aren’t far behind — in age or in driver safety. They are second to Gen Z in traffic death rate and each of the other metrics we examined.
The gap between Gen Z and Millennials for fatal crashes due to bad driving is narrow. For every 100,000 Millennials in America, there are 10 fatal crashes per year; for Zoomers, the rate is 10.49 crashes per 100,000.
But the margin between the two youngest generations is even slimmer for fatalities involving positive blood alcohol content and deaths involving driving under the influence.
3. Gen X (45 to 59 years old)
Generation X falls in the middle of the pack, though all of its crash and fatality rates are still higher than the national averages. For example, the yearly crash fatality rate among Gen X drivers is 19.13 per 100,000, which is much higher than the national rate of 12.28.
It’s worth noting that in each metric we analyzed, there’s a sharper drop between Millennials and Gen X than between Gen Z and Millennials. While the two youngest generations tend to stay close together in the metrics, Gen X sits lower, with crash and fatality rates generally closer to those of baby boomers.
This drop-off is the most dramatic when looking at the rates of fatalities involving speeding. Gen X drivers are involved in annual traffic deaths related to speeding at a rate of 4.83 per 100,000 — that’s 32% lower than the Millennial rate of 7.07.
4. Baby boomers (60 to 79 years old)
Despite some stereotypes to the contrary, baby boomers are the safest drivers on the road. While aging-related changes to vision, hearing or reaction time can present new challenges for seasoned drivers, their years (or, often, decades) of experience behind the wheel can also mean good judgment and well-practiced safe driving behaviors.
Baby boomers have the lowest fatal crash and traffic death rates of any generation currently driving America’s roadways. Their annual crash fatality rate of 15.72 per 100,000 is more than a third lower than Gen Z’s, 31% lower than Millennials’ and 18% lower than Gen X’s.
The data point highlighting perhaps the most dramatic difference in generations is related to fatalities involving driving under the influence: Boomers are involved in just 1.71 such fatalities per 100,000 each year. Contrast that with Gen Z drivers, at 4.60 deaths per 100,000.
The worst drivers in each state by generation
When you look at the data by location, in how many states does each generation have the most dangerous drivers?
Gen Z is the worst: Its drivers are the most dangerous of any generation in 29 states. Millennials come next, making up the most dangerous motorists in 16 states and Washington, D.C.
Baby boomers are not just the safest generation on the road overall — they are the safest drivers in every single state except one (South Dakota, where Gen Xers are safest).
In some states, though, dangerous driving isn’t associated with just a single age group — it’s dangerous, period. When we break down the states by worst drivers for each generation, six states appear in the top 10 for each, and another three states rank among the worst 10 for three of the four age groups.
Even more telling, the worst drivers in each generation are in the same two states: Montana and Wyoming. Montana ranks No. 1 for every generation except baby boomers; the worst baby boomer drivers are in Wyoming. In other analyses, we’ve found that Montana is also one of the worst states for teen driving safety and road rage.
How to stay safe behind the wheel at any age
Whether you’re fresh-faced and freshly licensed or have been around the block a few times, all drivers can benefit from brushing up on the best practices for safety behind the wheel. Check out these tips to tune up your safe driving habits:
- Consider a defensive driving course. These courses can refresh skills for older drivers and help younger drivers build safer habits early.
“The best protection is defensive driving: slowing down, leaving extra space between vehicles, scanning far ahead and avoiding sudden turns of the steering wheel,” said Chad Watwood, an attorney at LawBike Motorcycle Injury Lawyers, a firm in Georgia that specializes in motorcycle accident injury claims.
- Take extra care when driving on rough roads. Poorly maintained roads can make it difficult to maintain control of your vehicle, which can increase your risk of a car accident.
“When we talk about driving on bad roads, through potholes — think about it like driving in winter weather,” said Duane “Doc” Watson, a technical trainer and auto repair industry veteran at Bosch Mobility Aftermarket. “Drive cautiously, put more distance between yourself and the vehicle ahead of you so that you can see the potholes if there's any there, (and) do your best to avoid them without going out of your lane.”
- Cut the distractions. Distracted driving led to 3,275 crash fatalities in 2023, according to the NHTSA. It’s not just texting or talking on the phone — changing the music, eating, drinking or fixing your hair in the mirror all take your eyes off the road. It’s just not worth it.
- Protect yourself financially. While great car insurance won’t prevent an accident from happening, it can help make the aftermath slightly less miserable — and less expensive. As you tune up your vehicle and recommit to safe driving habits, make sure you check out your coverage, too.
Methodology
To determine which generations have the worst drivers, the ConsumerAffairs Research Team analyzed the most recently reported fatal crash data (2023) from the National Highway Traffic Safety Administration’s (NHTSA) Fatality Analysis Reporting System (FARS).
We examined five key metrics:
- Total fatalities from crashes of all types involving drivers from the generation
- Fatal crashes involving dangerous or improper driving behaviors (“bad driving”) by drivers from the generation
- Fatalities involving speeding by drivers of the generation
- Fatalities involving drivers of the generation with positive blood alcohol content (BAC) readings
- Fatalities involving driving under the influence (DUI) of drugs, alcohol or medication by drivers of the generation
In this analysis, “bad driving” refers to fatal crashes involving unsafe or improper driver behavior, including:
- Aggressive driving
- Careless driving
- Driving the wrong way on a one-way traffic way
- Failure to yield the right of way
- Following improperly
- Improper or erratic lane changing
- Making an improper turn
- Operating the vehicle in an erratic, reckless or negligent manner
- Operator inexperience
- Passing where prohibited
To ensure fair comparisons across generations, we calculated crash and fatality rates per 100,000 people within each age group.
We aligned each generation’s age range with U.S. Census Bureau population groupings. This required adjusting commonly accepted generation age ranges by one to two years. The resulting age ranges are:
- Gen Z: 15 to 29 years old
- Millennials: 30 to 44 years old
- Gen X: 45 to 59 years old
- Baby boomers: 60 to 79 years old
- All ages: Included for national baseline comparisons
Note: Fatality and crash totals by generation may be counted under multiple generations if drivers from different age groups were involved. For this reason, generational totals may not sum to the overall “all ages” counts.
Scoring and rankings
Each generation was scored on a 20-point scale for each of the five metrics. The generation with the highest fatal crash or fatality rate received the maximum score, while the remaining generations were assigned relative scores.
We then summed these scores to create an overall score, with a maximum possible total of 100 points.
In addition to national rankings, we analyzed crash data across all 50 states and Washington, D.C., to identify which generation ranks worst at the state level and where each generation’s worst drivers are located.
Reference policy
We love it when people share our findings! If you do, please link back to our original article to credit our research.
Questions?
For questions about the data or if you'd like to set up an interview, please contact dedens@consumeraffairs.com.
Article sources
ConsumerAffairs writers primarily rely on government data, industry experts and original research from other reputable publications to inform their work. Specific sources for this article include:
- National Highway Traffic Safety Administration, “Fatality Analysis Reporting System (FARS).” Accessed Feb. 6, 2026.
- U.S. Census Bureau, “S0101 | Age and Sex.” Accessed Feb. 6, 2026.
- National Highway Traffic Safety Administration, “Put the Phone Away or Pay.” Accessed Feb. 6, 2026.
Figures