Most expensive states to own a car
+1 more
Car ownership comes with a variety of expenses, from filling up the gas tank to covering unexpected repairs that may not be included under an extended car warranty. Keeping a car properly insured and maintained (and the tank full) isn’t cheap, and if it feels like those costs have only been rising, it’s not your imagination: In recent years, car-related costs have been climbing much faster than inflation — and faster than some consumers can keep up.
Over the past decade, gas prices have gone up about 20%, and the cost of car repairs has increased by 63%, according to federal statistics. And in the same period, car insurance premiums have soared by 94% — that’s nearly double the cost, wildly outpacing the cumulative inflation rate (approximately 36%). Cars themselves continue to get more expensive, too, especially as automakers face new or increased import tariffs for 2026 model year vehicles.
“Twenty years ago, the biggest factors in car ownership costs were fuel prices and financing rates. Today, technology and climate risks are just as important,” said Steven Cegelka, chief operating officer of Ignition Dealer Services. “Cars today are loaded with sensors and cameras that make even minor repairs far more expensive than a decade ago, and extreme weather is driving more (insurance) claims across the country. Even drivers with spotless records are feeling the squeeze.”
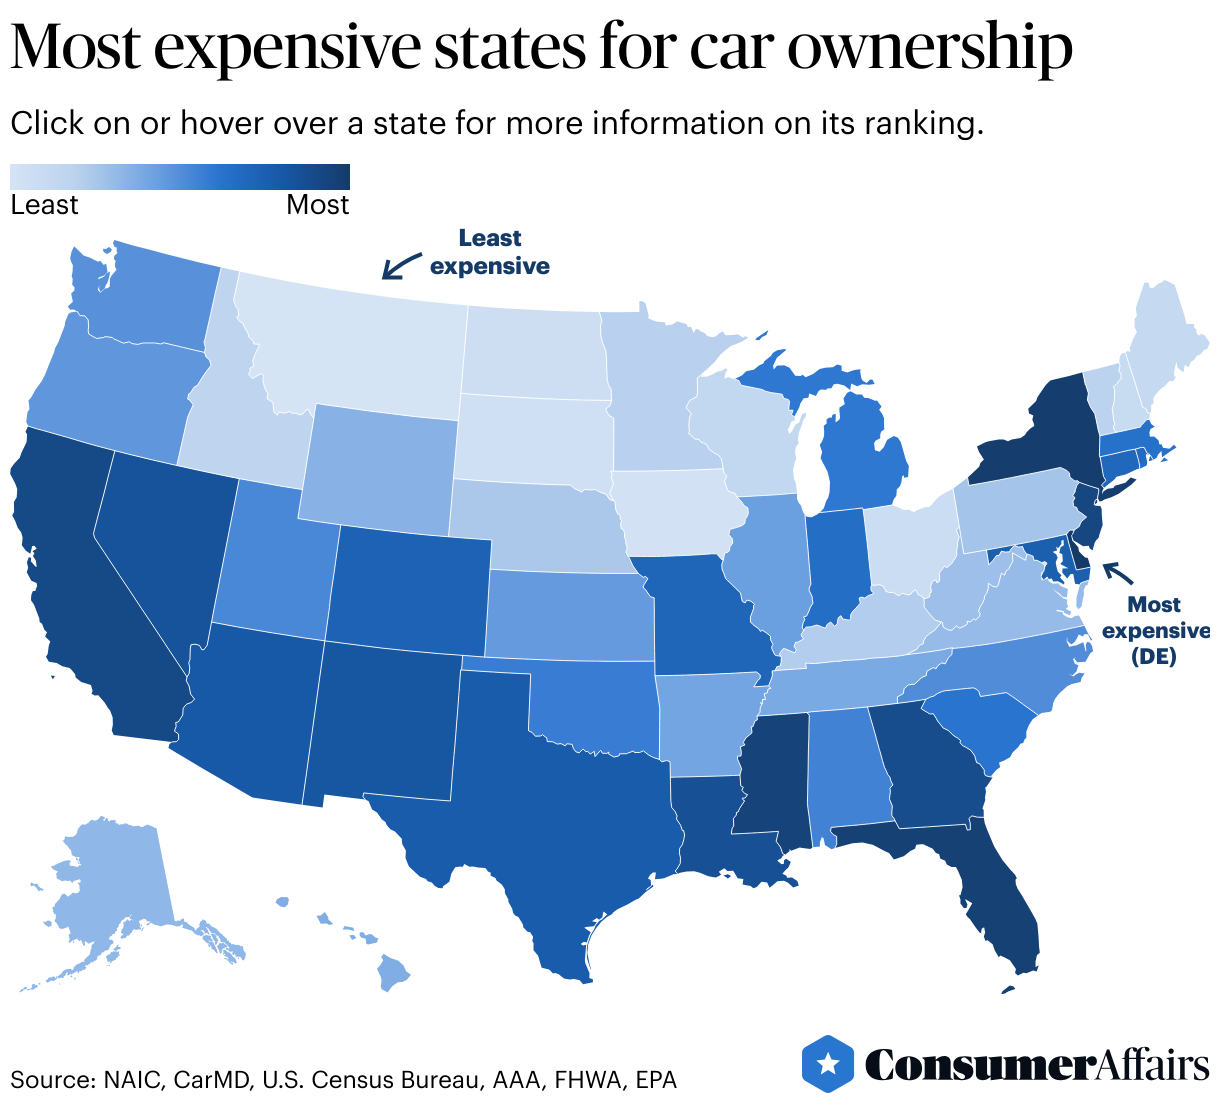
While drivers face rising costs nationwide, motorists in some areas fare worse than others. To calculate the cost of car ownership in each state, the ConsumerAffairs Research Team analyzed common auto-related expenses, including average annual car insurance premiums, repair costs and gas expenses (read our full methodology for more details). Check out the full analysis to see how your state stacks up.
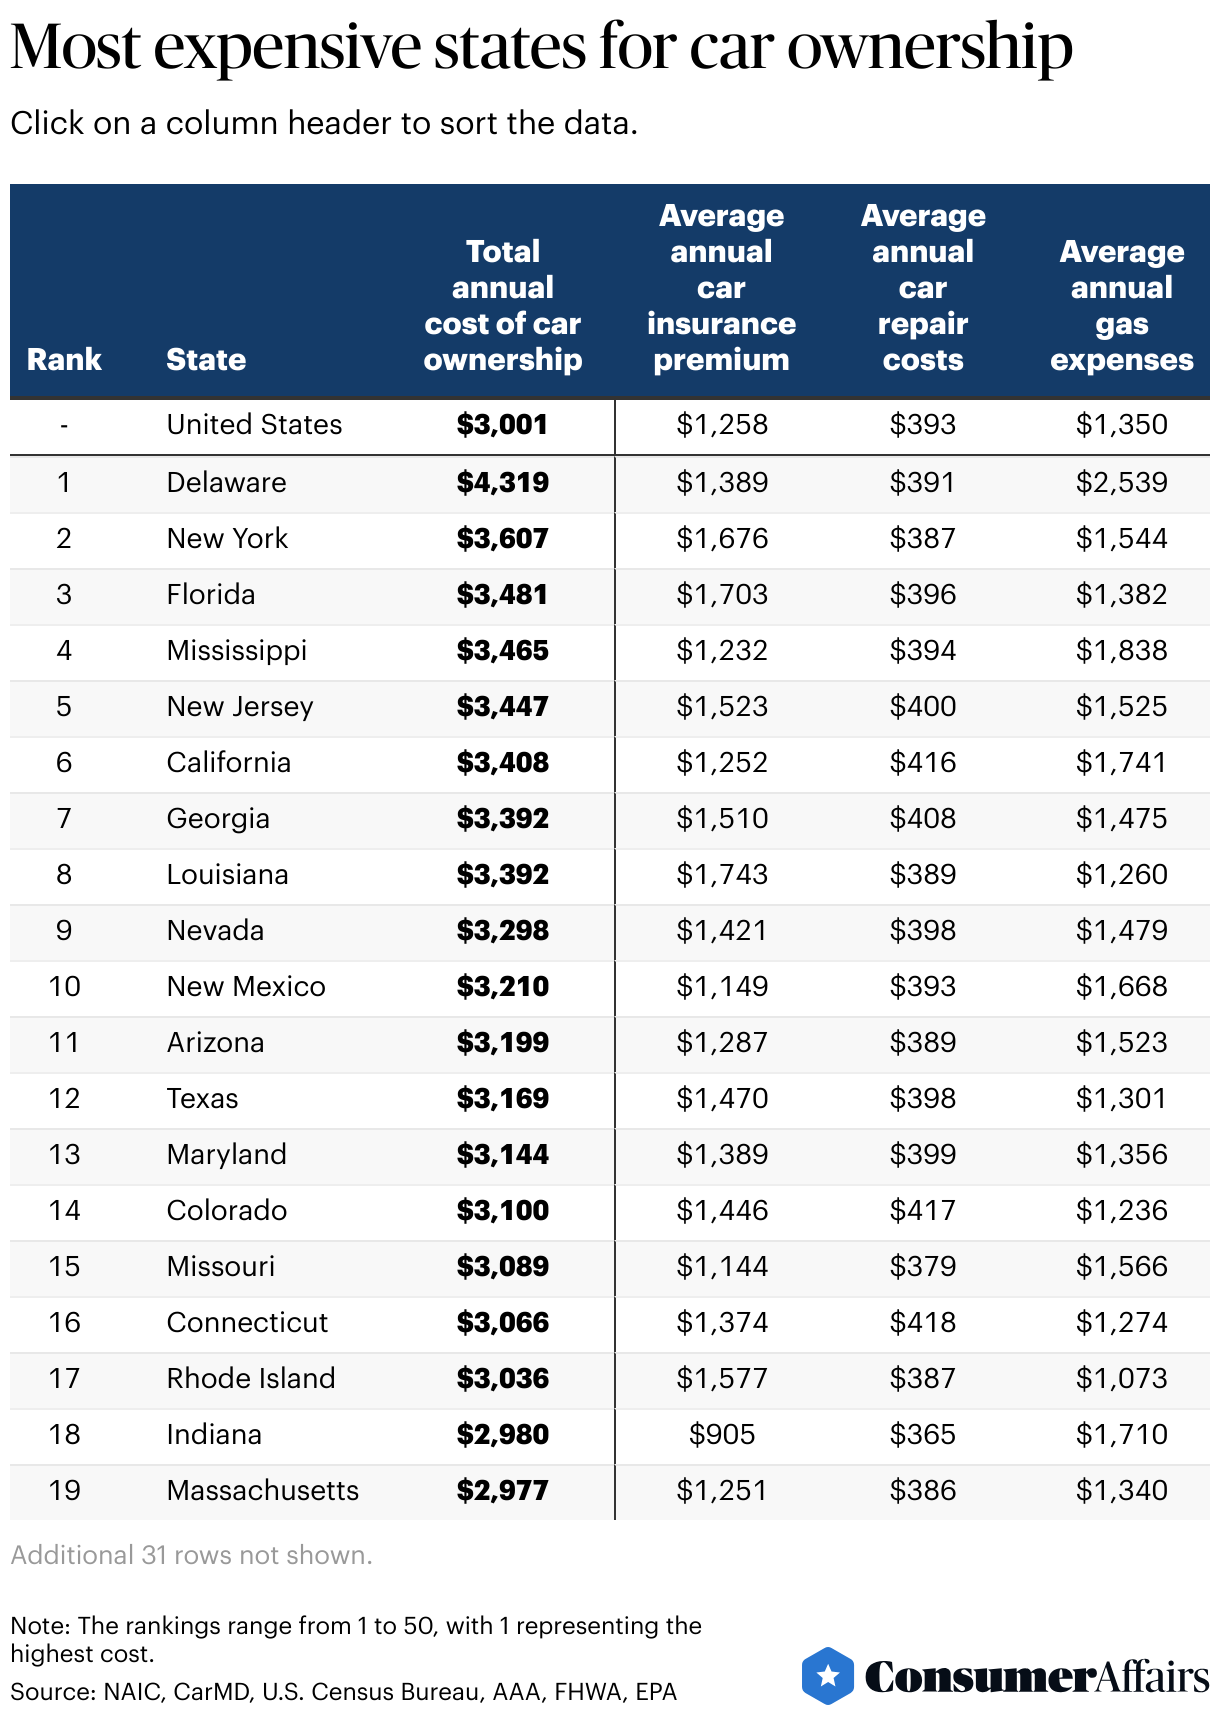
Delaware is the most expensive state for car ownership, with an average annual cost of $4,319 — 44% higher than the national average.
Jump to insightMontana is the cheapest, where car owners spend just $2,166 per year on auto-related expenses.
Jump to insightCar-related expenses hit Mississippians the hardest, accounting for about 6.4% of the state’s median income.
Jump to insightMidwestern states are absent from the 10 most expensive states for car ownership, but five of the 10 least expensive states are in the Midwest.
Jump to insightThe 10 most expensive states for car ownership
The states where car ownership costs the most are located across the country, from the Northeast to the South and West.
However, it’s worth noting that car-related costs don’t always follow the typical cost of living trends. The top 10 list contains a mix of more traditionally expensive states with high median incomes (New York, New Jersey and California) as well as states that tend to be more affordable, with lower median incomes (Mississippi, Louisiana and New Mexico).
So, what do these states have in common?
Broadly, the top 10 tend to have more dangerous roads — or dangerous drivers. Higher-than-average rates of traffic violations, collisions and crash-related deaths landed several of these states high rankings in ConsumerAffairs’ recent analyses of places with the worst roads, worst drivers and worst road rage.
“Every state has its own risk profile, regulatory environment and driving culture,” said Cegelka of Ignition Dealer Services. “A state with more young drivers, looser insurance rules or higher accident rates will naturally have higher costs.”
Does your state land among the most expensive for car owners? Read on to find out.
1. Delaware
In Delaware, average car ownership costs reach $4,319 each year, the highest in the nation. That’s 44% higher than the national average of $3,001.
Nearly 60% of that cost comes from fuel expenses. Drivers in the First State spend hundreds of dollars more on gas than drivers in any other state. While Delaware has the fewest vehicle registrations of any state, its drivers log the most miles on their cars — nearly 21,900 a year, on average. While gas prices there are below the national average, all of those miles add up to more than $2,500 a year for the average motorist.
Electric vehicle owners will face additional costs with the June 2025 passage of House Bill 164, a new transportation revenue law.
Annual average cost breakdown of car ownership in Delaware:
- Insurance premium: $1,389
- Repair costs: $391
- Gas expenses: $2,539 (highest in the nation)
- Total cost: $4,319
2. New York
The Empire State has the second-highest costs related to car ownership, at $3,607 a year — 20% higher than the national average. While average annual repair costs are actually below the national average by a small margin, New York has the third-highest car insurance premium in the country, and the seventh-highest fuel expenses, on average.
While New York’s median household income is above average, the state still ranks in the top quarter of states for how cost-burdened residents are by their cars. Vehicle-related expenses make up 4.4% of New York residents’ annual income, about half a point above the national average (3.9% or about $1 out of every $25 going toward car expenses).
Annual average cost breakdown of car ownership in New York:
- Insurance premium: $1,676 (third highest)
- Repair costs: $387
- Gas expenses: $1,544
- Total cost: $3,607
3. Florida
Florida ranks third worst for the high cost of car ownership. It has the second-highest average insurance premium in the country — a staggering $1,703 annually, or $142 each month. Repair costs and fuel expenses sit above national averages, too. Overall, Floridians pay about 16% more in car ownership costs than the national average.
Florida is also home to some of the nation’s worst drivers — Miami Gardens, Florida, ranked ninth worst in our latest analysis.
There is one bright spot for Sunshine State motorists, however. The top five auto insurers in the state are lowering rates by 6.5% in 2025. Some state officials point to 2023 state legislation aimed at reforming civil litigation as a reason for the decrease.
Annual average cost breakdown of car ownership in Florida:
- Insurance premium: $1,703 (second highest)
- Repair costs: $396
- Gas expenses: $1,382
- Total cost: $3,481
4. Mississippi
Car-related expenses impact Mississippians’ budgets harder than any other state’s residents, accounting for about 6.4% of the state’s median income. A single-digit percentage might not sound like a lot, but that’s more than $1 out of every $16 that a resident earns going to car ownership costs — and that’s not even including a monthly loan or lease payment.
Fortunately for drivers in the Magnolia State, car insurance rates in Mississippi should begin to stabilize. In August, the Mississippi Insurance Department approved decreases to insurance rates for more than 13 companies.
Annual average cost breakdown of car ownership in Mississippi:
- Insurance premium: $1,232
- Repair costs: $394
- Gas expenses: $1,838 (second highest)
- Total cost: $3,465
5. New Jersey
New Jersey ranks fifth most expensive for car ownership costs, with all three metrics in our analysis more expensive than the national averages. Fuel expenses in New Jersey are more than 13% higher than the national figure, and the annual car insurance premium in the Garden State is 21% higher than average.
Some New Jerseyans have identified a unique contributing factor to these high car insurance rates. In an op-ed earlier this year, Alex Daniel, formerly the vice president and general counsel at the New Jersey Civil Justice Institute, argued that a pro-litigation culture — and super-saturation of legal services advertisements in the state — has driven New Jersey drivers to “see legal action as the first step after a crash,” leading to a growing volume of car insurance claims that involve “prolonged legal disputes and higher settlement demands.”
Annual average cost breakdown of car ownership in New Jersey:
- Insurance premium: $1,523 (fifth highest)
- Repair costs: $400
- Gas expenses: $1,525
- Total cost: $3,447
6. California
California ranks sixth for the most expensive car-related costs. While the state’s average insurance premium is a hair ($6) below the national average, average annual repair costs and fuel expenses are both third highest in the country. Overall, it’s about $400 more expensive to own a car in California than across the U.S.
That the repair and fuel metrics rank high is no surprise: California has both the highest total vehicle miles traveled and the largest number of registered vehicles in the country. The state has even explored the alternative funding avenue of a “road charge,” or mileage-based user fee, where drivers are taxed based on how much they drive. (As more electric and hybrid vehicles populate the roadways, California will need additional revenue beyond the gas tax to fund road maintenance.)
Annual average cost breakdown of car ownership in California:
- Insurance premium: $1,252
- Repair costs: $416 (third highest)
- Gas expenses: $1,741 (third highest)
- Total cost: $3,408
7. Georgia
The Peach State ranks seventh most expensive for car ownership overall. The average annual insurance premium in Georgia is the sixth highest in the country, and 20% higher than the national average. Annual repair costs rank even higher, at fourth most expensive.
Some Georgia residents need to factor an additional annual expense, emissions testing, into their car care budgets. Emissions testing is required for vehicles that are between 4 and 24 model years old registered in the 13 counties that make up the Atlanta metro area. The metro has some of the nation’s worst traffic and a failing grade for average particle pollution from the American Lung Association.
Annual average cost breakdown of car ownership in Georgia:
- Insurance premium: $1,510
- Repair costs: $408 (fourth highest)
- Gas expenses: $1,475
- Total cost: $3,392
8. Louisiana
Louisiana ranks eighth overall but is virtually tied with Georgia for total average car ownership costs. The Pelican State ranks near the middle of the pack for average car repair and fuel costs, but it is worst in the U.S. when it comes to car insurance: Louisiana has the highest average insurance premium in the country, at $485 more than the national average, or a difference of 39%.
Louisiana also ranks as the state with the worst road rage. It has the second-highest rate of traffic violations for aggressive or careless driving or speeding, almost certainly a factor in the state’s high insurance premiums. Tragically, almost three in five of the state’s fatal crashes and traffic deaths are linked to these poor driving behaviors — the highest rates in the nation.
Annual average cost breakdown of car ownership in Louisiana:
- Insurance premium: $1,743 (highest)
- Repair costs: $389
- Gas expenses: $1,260
- Total cost: $3,392
9. Nevada
Nevada ranks ninth most expensive overall, and ranks consistently for the key metrics in our analysis — landing in the top dozen states for average insurance premium, cost of car repairs and fuel costs. Overall, it’s about 10% more expensive to own a car in the Silver State than the national average.
On top of these costs, Nevada motorists should be prepared for car registration fees and a potentially significant “governmental services tax,” too. (The state uses vehicle registration fees to fund road construction and the DMV; the governmental services tax goes toward local governments, schools, and the state general fund.) While passenger cars have a flat registration fee of $33, the governmental services tax is based on a vehicle valuation.
Annual average cost breakdown of car ownership in Nevada:
- Insurance premium: $1,421
- Repair costs: $398
- Gas expenses: $1,479
- Total cost: $3,298
10. New Mexico
New Mexico, another Mountain state, rounds out the list, ranking 10th most expensive for average annual car ownership costs.
In some metrics, New Mexico actually isn’t as pricey as other states farther down our list. Typical repair costs in the Land of Enchantment are on par with the national average, and the insurance premium in the state is actually about 9% lower. New Mexico earned its spot in the top 10 because its drivers spend a significant amount on gas: an average of $1,668 per year, the fifth highest of all states.
It’s not that gas prices in New Mexico are astronomically high — the state’s average price per gallon is actually below the national average. New Mexico’s motorists spend so much on gas because of how much they drive, logging an average of 14,755 miles per vehicle in a year, the third most of all U.S. states.
It doesn’t help that they’re driving on the worst roads in the nation. Nearly 42% of the state’s urban roads and 31% of rural roads are in poor condition.
Annual average cost breakdown of car ownership in New Mexico:
- Insurance premium: $1,149
- Repair costs: $393
- Gas expenses: $1,668 (fifth highest)
- Total cost: $3,210
The cheapest states for car ownership
Overall, the Midwest is the least expensive region for car ownership. It has five of the 10 cheapest states, and it doesn’t have a single state in the list of the 10 most expensive. (The most costly Midwestern state for car ownership is Missouri, ranked 15th.)
Despite all this Midwest representation, it’s actually a Western state that tops the list of cheapest states. Car ownership is the most affordable in Montana, where it costs an average of $2,166 each year to cover car insurance, repairs and gas. That’s almost 28% cheaper than the national average ($3,001).
It costs the least to own a car in the following states:
- Montana
- Iowa
- South Dakota
- North Dakota
- Ohio
- New Hampshire
- Maine
- Wisconsin
- Idaho
- Vermont
New Hampshire, ranked sixth cheapest overall, is the state where residents are least cost-burdened by their car expenses. Thanks to the state’s low fuel, repair and insurance costs, and the fact that it has one of the highest median household incomes in the country ($96,838), New Hampshire motorists spend just $1 of every $40 they earn on those car-related costs.
The annual cost of owning a car in each state
Above, we dug into the data for the states that rank at the top and bottom of the list. But how does the rest of the country compare?
“The cost of car ownership is generally reflected by the local market, and that each local market has its own particular combination of factors: everything from risks from climate change, weather-related hazards, traffic congestion, differing gas prices and tax policies,” said Doug Burnetti, a Florida-based attorney with expertise in automotive law.
“States that are at risk of being hit by natural disasters such as hurricanes or wildfires, or have higher levels of traffic congestion, typically end up being more expensive than rural states with fewer risks and difficulties,” he said.
Check out the full data for all 50 states below. How do your car-related costs compare with the rest of your state — or the rest of the nation?
How to save on car ownership costs
Are you spending more on car-related costs than drivers in the rest of your state, or simply more than you’d like to be paying? To learn how to save on car insurance, we spoke with Katie Ekstrom, assistant vice president of auto product development at the insurance company Travelers, who offered the following advice:
- Maximize your savings on car insurance. Review your policy annually to assess your coverage needs and adjust them as necessary. “You might be paying for coverage you no longer need,” Ekstrom said.
- Increase your deductible. You can opt for a policy with a higher deductible to lower your monthly premium. “Just ensure you can afford the deductible in case of a claim,” Ekstrom said.
- Maintain a good driving record. “Safe driving can lead to lower rates,” Ekstrom said. Wear your seat belt, follow the speed limit, and eliminate distractions to avoid traffic violations and reduce your risk of an accident.
To learn more about saving money on car repairs, we spoke with Fred Padgett, a technical specialist at Bosch Automotive Aftermarket, who offered these tips to save money with shop visits and repairs:
- Don’t ignore the little things. When it comes to vehicles, “small problems rarely stay small,” Padgett said. A dashboard warning light, small leak or weird smell may seem harmless, but those early signs point to wear that will only worsen. Addressing issues as they appear is always cheaper and faster than waiting until a component completely fails.
- Change your oil at home. Changing your own oil may sound intimidating, but it doesn’t have to be. “It’s really just a drain pan, a wrench, and an hour of your time,” Padgett said. “Using good oil and a quality filter, you can skip the shop’s labor charge and keep your engine healthy for less.”
- Replace your own air filters. “Air filters play a very important role in keeping our engines and our lungs healthy,” Padgett said. Replacing a cabin air filter takes just five or 10 minutes, and it costs a lot less than paying at the shop for the supplies and labor.
- Check your tire pressure regularly. Properly inflated tires improve your car’s fuel economy, extend the life of the tires and help your car drive better overall. “A $15 gauge and a few minutes at a gas station air pump can save hundreds in premature tire wear and wasted fuel,” Padgett said.
- Know your owners manual. “Most people never read through their owners manual, but it’s one of the best free maintenance guides you’ll ever get,” said Padgett. Take 10 minutes to get familiar with your owners manual and learn how often you should change fluids, rotate tires, replace filters and do anything else involved with keeping your car running smoothly.
Methodology
The ConsumerAffairs Research Team determined the most expensive states for car ownership by calculating the average annual cost of three common auto-related expenses: car insurance, repairs and fuel.
The car insurance premium includes liability, collision and comprehensive coverage. The repair cost includes parts and labor for repairs that illuminate a check engine light.
To estimate annual gas expenses in each state, we first divided total vehicle miles traveled by the number of registered vehicles to find the average miles driven per vehicle. We then divided that figure by the national average fuel economy (27.1 miles per gallon) to estimate annual fuel consumption. Finally, we multiplied fuel consumption by the state’s average gas price to calculate yearly gas costs.
Our data sources include the National Association of Insurance Commissioners (2022), CarMD (2021), AAA (2025), the Federal Highway Administration (2023) and the Environmental Protection Agency (2023).
We also collected supplemental data on each state’s median household income from the U.S. Census Bureau (2023) to provide context for narrative comparisons. This information did not influence our cost calculations or rankings.
Reference policy
We love it when people share our findings! If you do, please link back to our original article to credit our research.
Questions?
For questions about the data or if you'd like to set up an interview, please contact rsowell@consumeraffairs.com.
Article sources
ConsumerAffairs writers primarily rely on government data, industry experts and original research from other reputable publications to inform their work. Specific sources for this article include:
- National Association of Insurance Commissioners, “2021/2022 Auto Insurance Database Report.” Accessed Sept. 22, 2025.
- CarMD, “CarMD Finds Check Engine Car Repair Costs Lowest in Maine, Highest in Connecticut in 2021.” Accessed Sept. 22, 2025.
- U.S. Census Bureau, “Median household income 2023.” Accessed Sept. 22, 2025.
- AAA Fuel Prices, “State Gas Price Averages.” Accessed Sept. 22, 2025.
- Federal Highway Administration, “FUNCTIONAL SYSTEM TRAVEL - 2023 ANNUAL VEHICLE - MILES.” Accessed Sept. 22, 2025.
- United States Environmental Protection Agency, “The 2024 EPA Automotive Trends Report.” Accessed Sept. 22, 2025.
- Federal Highway Administration, “State Motor-Vehicle Registrations - 2023.” Accessed Sept. 22, 2025.
- U.S. Energy Information Administration, “U.S. All Grades All Formulations Retail Gasoline Prices.” Accessed Sept. 21, 2025.
- Federal Reserve Bank of St. Louis, “Consumer Price Index for All Urban Consumers: Motor Vehicle Maintenance and Repair in U.S. City Average (CUUR0000SETD).” Accessed Sept. 21, 2025.
- U.S. Bureau of Labor Statistics, “Motor vehicle insurance in U.S. city average, all urban consumers, not seasonally adjusted].” Accessed Sept. 21, 2025.
- U.S. Bureau of Labor Statistics, “CPI Inflation Calculator.” Accessed Sept. 21, 2025.
- Marketplace, “As carmakers face tariff costs, the new model year is giving them an excuse to raise prices.” Accessed Sept. 21, 2025.
- Delaware General Assembly, “House Bill 164.” Accessed Sept. 21, 2025.
- Delaware Public Media, “Del. House approves DNREC, DelDOT fee packages to up DMV fees and create new ones for EV owners.” Accessed Sept. 21, 2025.
- Florida Office of Insurance Regulation, “Florida Office of Insurance Regulation Announces Lower Auto Insurance Rates Thanks to Florida's Insurance Reforms.” Accessed Sept. 21, 2025.
- Roy Howard Community Journalism Center, “Mississippi auto insurance rates begin to stabilize after years of increases.” Accessed Sept. 21, 2025.
- NJ Spotlight News, “Op-Ed: Billboard attorneys and fraudsters are driving up NJ auto insurance costs.” Accessed Sept. 21, 2025.
- State of California “Road Charge Program.” Accessed Sept. 21, 2025.
- State of California, “FAQs.” Accessed Sept. 21, 2025.
- Georgia Environmental Protection Division, “Inspection and Maintenance (I/M) Unit.” Accessed Sept. 21, 2025.
- Georgia’s Clean Air Force, “Before You Test.” Accessed Sept. 24, 2025.
- American Lung Association, “New Report: Atlanta’s Air Quality Worsens; Is Among Worst in Southeast for Ozone Smog and Year-Round Particle Pollution.” Accessed Sept. 21, 2025.
- Nevada Department of Motor Vehicles, “Vehicle Registration Fees.” Accessed Sept. 21, 2025.
Figures