The Best and Worst Airports in the U.S. for Flight Delays and Cancellations

+1 more

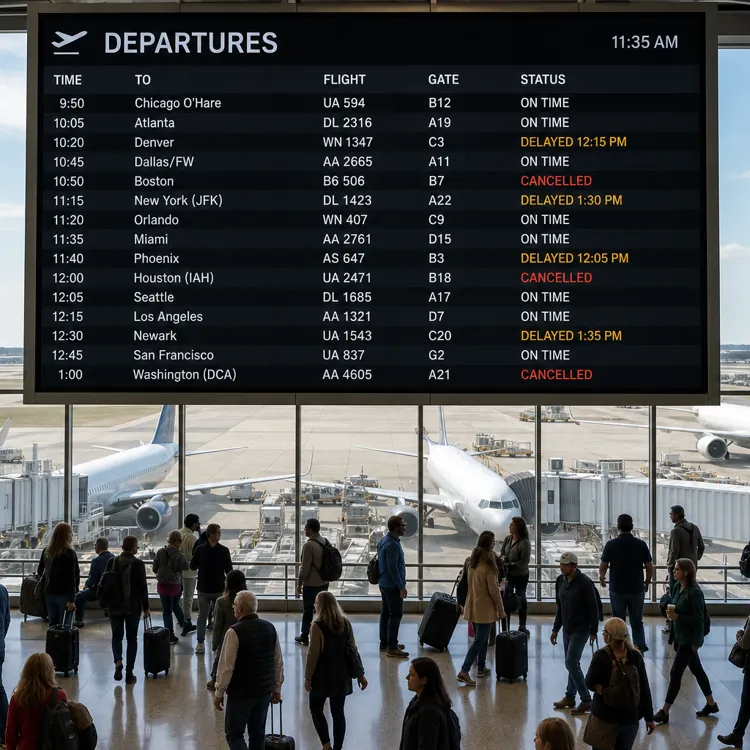
You’re sitting at the gate, and your departure time just got pushed back another 20 minutes. As you watch the minutes tick by, you can’t help but wonder, “Is this just bad luck, or does this airport have a track record of keeping travelers waiting?”
You might assume the biggest airports cause the biggest headaches, but that’s not always true. Some of the country’s busiest hubs actually rank among the best performers. No airport is immune to a bad travel day, though, so it’s worth comparing travel insurance options before you fly.
To find out which airports handle travel disruptions best, the ConsumerAffairs Research Team analyzed U.S. Department of Transportation flight data from 2024 to 2025. We ranked airports within three size groups (small, medium and large) based on how severe their disruptions are, how frequently they happen and how easily travelers can recover. Keep reading to see how the nation’s major hubs compare, and find your airport in the full rankings below.
Key insights
Ronald Reagan Washington National (DCA) has the highest cancellation rate of any airport studied, at 2.8% of scheduled departures.
Jump to insightLos Angeles (LAX) leads the nation in flight recovery options, averaging 5.7 alternative same-day flights to the same destination and the lowest share of last-flight-of-the-day cancellations.
Jump to insightSeven of the 10 worst major hubs for flight disruptions are in the South, yet Atlanta’s Hartsfield-Jackson stands out as fifth best.
Jump to insightThe Sunday after Thanksgiving was the worst holiday travel day in 2025, with 49% of flights disrupted. Thanksgiving Day itself only registered 7%.
Jump to insightThe worst major U.S. airports for flight delays and cancellations
Not all flight disruptions are created equal, and neither are the airports that struggle with them. Cancellations are Reagan National’s biggest problem, not delays. Newark, meanwhile, struggles most with long, severe delays. And in Miami, disruptions don’t happen all that often — they’re just more likely to be diversions when they do. Knowing which is which matters, since cancellations and delays call for different next steps.
“With a cancellation, you have some certainty that your flight is not taking you to your destination,” said Jeremy Murchland, the president of Seven Corners, a travel insurance company headquartered in Carmel, Indiana. “In this case, the priority should be around finding another way to get where you’re going, looking at other flights, and maybe even looking at other nearby airports.”
A delay is trickier, since the situation keeps changing, so Murchland suggested tracking it in real time through the airline’s app.
Check out the map below. Then, read on for a closer look at the five worst-performing major hubs.

1. Ronald Reagan Washington National (DCA)
At no U.S. airport — large, medium or small — are you more likely to experience a flight cancellation than at DCA. Over the two-year period we examined, 2.8% of scheduled flights left passengers scrambling for alternative options.
When delays hit, they often start elsewhere. Late-arriving aircraft accounted for nearly half of Reagan National’s delay minutes, the highest share among the five worst major airports, meaning planes often came in late from another city rather than something going wrong at DCA itself.
- Cancellation rate: 2.8% of scheduled departures
- Delayed 15 minutes to three hours: 21.01%
- Delayed over three hours: 1.96%
- Diverted: 0.23% of scheduled departures
- Average same-day flights to the same destination: 3.18
- Cancellations that were the last flight of the day to that destination: 37.89%
2. Dallas-Fort Worth International (DFW)
Unlike DCA, DFW’s standout problem isn’t cancellations. It’s the volume of delays. More of its flights land in that frustrating middle zone, delayed 15 minutes to just under three hours, than at any other large airport in the study. It’s the kind of delay that eats into your day without necessarily blowing up your whole trip.
There’s a silver lining if it does become disruptive. DFW offered more scheduled backup flights to the same destination than many of the other airports on this list, giving travelers a decent shot at rebooking if a flight fell through.
- Cancellation rate: 2.31% of scheduled departures
- Delayed 15 minutes to three hours: 25.18%
- Delayed over three hours: 1.96%
- Diverted: 0.29% of scheduled departures
- Average same-day flights to the same destination: 3.95
- Cancellations that were the last flight of the day to that destination: 24.88%
3. Newark Liberty International (EWR)
EWR posted the highest severe-delay rate of any large airport in the study. Among flights that arrived late, the average delay ran about 80 minutes, longer than most other large airports on this list.
Newark’s operational limitations may help contextualize the trend. The airport spent much of 2025 dealing with air traffic controller shortages, equipment problems and runway construction. To combat the issue, the Federal Aviation Administration (FAA) decreased the number of flights permitted there per hour — an order that was renewed through October 2027.
- Cancellation rate: 2.67% of scheduled departures
- Delayed 15 minutes to three hours: 21.03%
- Delayed over three hours: 2.17%
- Diverted: 0.25% of scheduled departures
- Average same-day flights to the same destination: 4.16
- Cancellations that were the last flight of the day to that destination: 30.86%
4. Miami International (MIA)
MIA posted the highest diversion rate among these five. Its severity score, which accounts for both severe delays and diversions, was also the worst of any large airport in the study. Its frequency score, by contrast, was the second-mildest of the five, meaning moderate delays and cancellations arise less often here than at most others on this list.
- Cancellation rate: 1.49% of scheduled departures
- Delayed 15 minutes to three hours: 24.45%
- Delayed over three hours: 1.99%
- Diverted: 0.32% of scheduled departures
- Average same-day flights to the same destination: 3.57
- Cancellations that were the last flight of the day to that destination: 22.99%
5. Philadelphia International (PHL)
PHL has the second-highest severity score of all large airports studied. Plus, over a third of its cancellations were the last flight of the day to that destination, leaving many travelers with no same-day option. Among flights that did arrive late, the average delay ran about 80 minutes, the second-longest average of all large airports on the list.
- Cancellation rate: 1.75% of scheduled departures
- Delayed 15 minutes to three hours: 20.69%
- Delayed over three hours: 1.97%
- Diverted: 0.29% of scheduled departures
- Average same-day flights to the same destination: 3.31
- Cancellations that were the last flight of the day to that destination: 36.17%
The best major airports for avoiding travel disruptions
The following five airports posted the best disruption scores in their class, and a similar pattern shows up across the full study. Most of the 30 best-performing airports across the three size groups (the top 10 in each) are out West. California alone is home to 10 of them. The two best small airports in the country, Lihue and Kona, are in Hawaii — you’ll find them in the full rankings below.
The most surprising name on this list might be the most familiar one. Los Angeles International, one of the busiest airports in the country, is the best-performing large airport in the study — a sign that size alone doesn’t determine delay rates.
1. Los Angeles International (LAX)
LAX has a reputation for traffic headaches, but this study found that it actually leads in reliability. On that front, LAX’s severe-delay rate is low, offset by a diversion rate on the higher side (netting out to a middling severity score for a large airport).
Where LAX stands out is recovery. Cancellations are relatively rare, but when one does happen, there are around 5.68 other flights heading to the same destination on a given day. An airport moving this many flights has more seats to shuffle passengers into when something goes wrong.
- Cancellation rate: 0.78% of scheduled departures
- Moderate-delay rate: 16.89%
- Severe-delay rate: 1.14%
- Diversion rate: 0.30% of scheduled departures
- Other same-day flights to the same destination: an average of 5.68
- Cancellations that were the last flight of the day to that destination: 15.81%
2. Phoenix Sky Harbor International (PHX)
PHX backs up the pattern that larger volumes don’t necessarily result in decreased efficiency. The airport handles tens of millions of passengers per year, yet cancellations are rare and severe delays are uncommon.
PHX falls a bit short of LAX on backup options, though. It offers fewer same-day alternatives if a flight is disrupted, and a canceled flight here is more likely to be the last one of the day to that destination.
- Cancellation rate: 0.67% of scheduled departures
- Moderate-delay rate: 18.28%
- Severe-delay rate: 0.93%
- Diversion rate: 0.26% of scheduled departures
- Other same-day flights to the same destination: an average of 4.48
- Cancellations that were the last flight of the day to that destination: 19%
3. Seattle-Tacoma International (SEA)
It’s easy to assume dry, sunny weather explains why so many of the best airports are out West. But Seattle is famously rainy, and it posted the lowest severe-delay rate of any large airport in the study, along with the shortest average delay when flights did run late.
Significant weather accounts for just 4.51% of SEA’s reported delay minutes. Airline-caused issues, like maintenance and crew problems, make up 41.06%, the largest share of any cause at this airport.
- Cancellation rate: 0.95% of scheduled departures
- Moderate-delay rate: 20.25%
- Severe-delay rate: 0.65%
- Diversion rate: 0.27% of scheduled departures
- Other same-day flights to the same destination: an average of 4.62
- Cancellations that were the last flight of the day to that destination: 22.38%
4. Salt Lake City International (SLC)
SLC posted the lowest cancellation rate and the lowest moderate-delay rate of any large airport in the study. Its weak spot is what happens next if something does go wrong. With an average of only 2.73 other same-day flights to the same destination, it has one of the thinnest safety nets among large airports.
This airport has been in the middle of a redevelopment project since 2020. Fewer gates in service due to construction may result in fewer flights to fall back on when one gets disrupted. However, the project is set to be completed when the final gates open in late October 2026.
- Cancellation rate: 0.57% of scheduled departures
- Moderate-delay rate: 15.48%
- Severe-delay rate: 0.95%
- Diversion rate: 0.27% of scheduled departures
- Other same-day flights to the same destination: an average of 2.73
- Cancellations that were the last flight of the day to that destination: 24.49%
5. Hartsfield-Jackson Atlanta International (ATL)
ATL is actually the world’s busiest airport by passenger volume, according to a study from Airports Council International World. Despite this, it posted the second-best recovery score of any large airport in the study, trailing only LAX. That means if a flight here is canceled or delayed, a traveler has an above-average chance of finding a same-day option out.
- Cancellation rate: 1.24% of scheduled departures
- Moderate-delay rate: 20.21%
- Severe-delay rate: 1.25%
- Diversion rate: 0.26% of scheduled departures
- Other same-day flights to the same destination: an average of 5.45
- Cancellations that were the last flight of the day to that destination: 18.81%
Here’s a look at our full data
Most U.S. airports aren’t major hubs. Of the 122 airports in this study, 93 are medium or small, and millions of travelers depend on them.
As with the large airports above, we scored each airport only against others of its own size, so the table below is split into three tabs (one per size class):
Note: Palm Beach International (PBI), the worst-performing medium airport in our study, was recently renamed President Donald J. Trump International Airport (DJT). While the table reflects the airport’s new name and code, all rankings and holiday data are based on flights recorded under its former name and code.
Smaller airports don’t necessarily see more things go wrong. They just have fewer ways to fix it.
At St. Pete-Clearwater, travelers had access to essentially no backup flights, an average of just 0.06, and 95.44% of its cancellations were the last flight of the day to that destination. For a traveler at this airport, a canceled flight often means waiting until the next day.
Asheville tells a similar story, with an average of 1.22 other same-day flights, compared with 5.68 at LAX.
Where holiday travel causes the biggest airport disruptions
This section measures something different from the rankings above: It shows how each airport's disruptions change during the holidays compared with its baseline, not which airport is worst overall.
That increase skews toward smaller airports. Grand Rapids and Syracuse each got more than 14 percentage points worse over the holidays — more than Detroit, the worst-hit large airport at 13.8 points.
Not every airport got worse, though. Of the 122 we studied, 106 saw higher disruption rates over the holidays, but 16 actually improved, including Reagan National and Asheville (the worst large and small airports overall).
Those traveling on Thanksgiving Day and Christmas Day can rest assured: They averaged disruption rates of just 8% and 11%, respectively, across 2024 and 2025. Three days after Thanksgiving, on Sunday, Nov. 30, 2025, that number hit 49%, the single worst day in that span.
How to protect your trip when your airport works against you
Even a well-cushioned airport can be chaotic, but a few best practices can help make that day less costly:
- Look into travel insurance. “Travel insurance can be valuable when a covered delay or cancellation leaves you with costs you cannot recover elsewhere, such as a hotel, meals or prepaid nonrefundable trip expenses,” said Jennifer Rykaczewski, the CEO of Affordable Skies, a nonprofit consumer advocacy organization headquartered in Washington, D.C. “Policies have specific covered reasons, minimum delay periods, dollar limits, exclusions and documentation requirements, \[so\] read the actual policy before buying.”
- Book with disruptions in mind, not just price. “Before you book, I recommend looking for a nonstop flight if you can, as well as an earlier departure on an airline with several flights to your destination that day,” said Murchland of Seven Corners. Being on the only flight of the day, or the last one, leaves fewer options if something goes wrong.
- Give yourself more cushion at a smaller airport. “I would take the earliest possible flight for the day to keep options open, and I would also not book a tight connection,” Murchland added. If you’re traveling for something you can’t miss, consider flying a day early.
- Act fast if something goes wrong. “In the first 10 minutes, open the airline app, see whether you have already been rebooked and search for acceptable alternatives,” Rykaczewski advised. Throughout the process, save any documentation of the delay or cancellation, plus receipts for meals or hotels, in case you need it for an insurance claim later.
Methodology
The ConsumerAffairs Research Team analyzed U.S. Department of Transportation flight records from 2024 and 2025 to rank U.S. airports on how likely travelers are to experience a flight disruption — and how difficult it may be to recover when something goes wrong.
We scored each eligible airport across three categories, totaling 100 points:
Severity of flight disruptions (40 points):
- Severe-delay rate (25 points): departures that arrived at least three hours late, as a share of all scheduled departures
- Diversion rate (15 points): departures that were diverted to an airport other than their original destination, as a share of all scheduled departures
Frequency of flight disruptions (35 points):
- Cancellation rate (20 points): canceled departures as a share of all scheduled departures
- Moderate-delay rate (15 points): departures that arrived at least 15 minutes late but less than three hours late, as a share of all scheduled departures
Ability to recover from disruptions (25 points):
- Average other same-day flights (15 points): the average number of other scheduled flights leaving that airport for the same destination on the same day (more alternatives suggest a traveler may have more opportunities to reach the destination after a disruption, not whether a traveler could actually be rebooked on them
- Last-flight cancellation share (10 points): among an airport's cancellations, the share that affected the final scheduled departure to that destination that day
For each category metric, the worst-performing airport received the maximum number of points, with others scored proportionally. We then added scores together to get an overall disruption score. All metrics describe flights departing that airport.
Airports were grouped using FAA hub size classifications, and each airport was scored and ranked only against others in its own size group. To qualify, an airport needed reported flight data covering at least 85% of its scheduled departures and at least 1,000 scheduled departures in the full study period, the holiday windows and the nonholiday baseline. Of 138 airports examined, 122 qualified.
Separately from the overall ranking, we compared each airport's rate of delays and cancellations during the Thanksgiving and winter holiday travel periods with its typical performance during the rest of the year, to show which airports got significantly worse during the holidays. The Thanksgiving window runs from the Tuesday before Thanksgiving through the Monday after, and the winter holiday window runs from Dec. 18 through Jan. 5.
Reference policy
We love it when people share our findings! If you do, please link back to our original article to credit our research.
Questions?
For questions about the data or if you'd like to set up an interview, please contact jrodriguez@consumeraffairs.com.
Article sources
ConsumerAffairs writers primarily rely on government data, industry experts and original research from other reputable publications to inform their work. Specific sources for this article include:
- Federal Aviation Administration, "FAA Issues Final Order on Flight Arrival Rate at Newark Liberty International Airport." Accessed Sept. 26, 2026.
- Federal Aviation Administration, "FAA Issues Interim Order Reducing the Flight Arrival and Departure Rate at Newark Liberty International Airport." Accessed Sept. 26, 2026.
- Federal Aviation Administration, "FAA Extends Order Limiting Operations at Newark Liberty International Airport." Accessed Sept. 26, 2026.
- City of Phoenix Aviation Department, "PHX Media Kit: Facts & Numbers." Accessed Sept. 26, 2026.
- Salt Lake City Department of Airports, "The New SLC Project Fact Sheet." Accessed Sept. 26, 2026.
- Salt Lake City Department of Airports, "SLC International Airport to Mark Completion of The New SLC." Accessed Sept. 26, 2026.
- OAG Aviation Worldwide Limited, "Atlanta Retains Crown as World’s Busiest Airport 2025." Accessed Sept. 26, 2026.
- Airports Council International World, "World’s Busiest Airports Revealed in Latest Global Rankings." Accessed Sept. 26, 2026.
- U.S. Department of Transportation, “Bureau of Transportation Statistics.” Accessed Sept. 26, 2026.
- Federal Aviation Administration, “Passenger Boarding (Enplanement) and All-Cargo Data for U.S. Airports.” Accessed Sept. 26, 2026.
Figures