How Many Miles Does the Average Person Drive a Year? 2026
+2 more

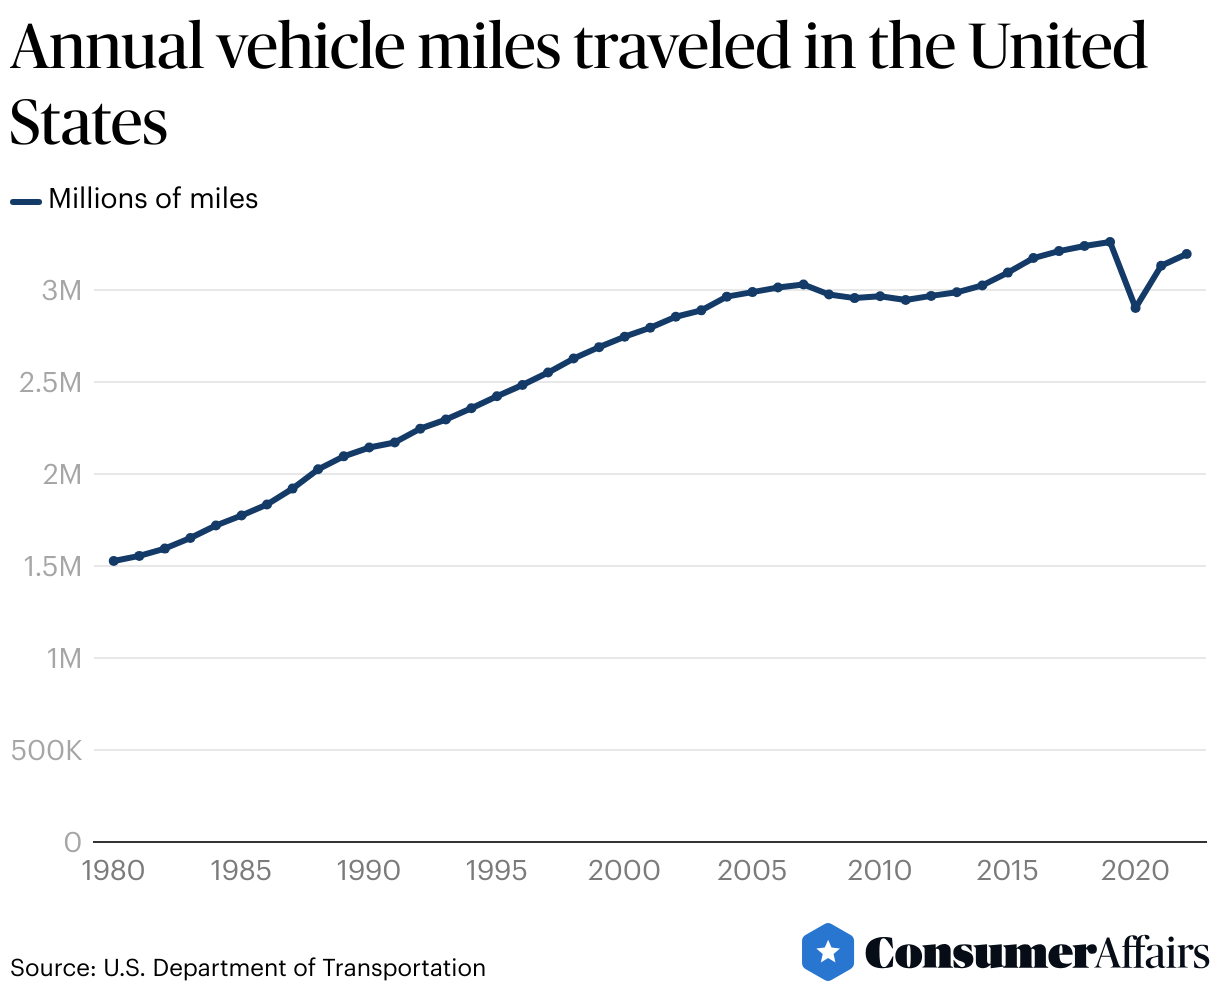
The amount of driving Americans do each year dipped noticeably during 2020, due to the COVID-19 pandemic and its impacts on work and travel. Since then, the number of people driving has rebounded, albeit not to pre-pandemic levels. Nevertheless, since 1971, the amount of total annual miles driven has nearly tripled in the U.S., rising from 1.1 trillion to 3.2 trillion miles.
In 2022, the average U.S. driver drove 13,596 miles. This number represents an increase from 2020 and 2021, but still falls below 2019 numbers.
Jump to insightDrivers cite running errands as the primary reason for getting in the car, accounting for 30.3% of their car trips. Commuting to work accounting for 21.6% of individual car trips.
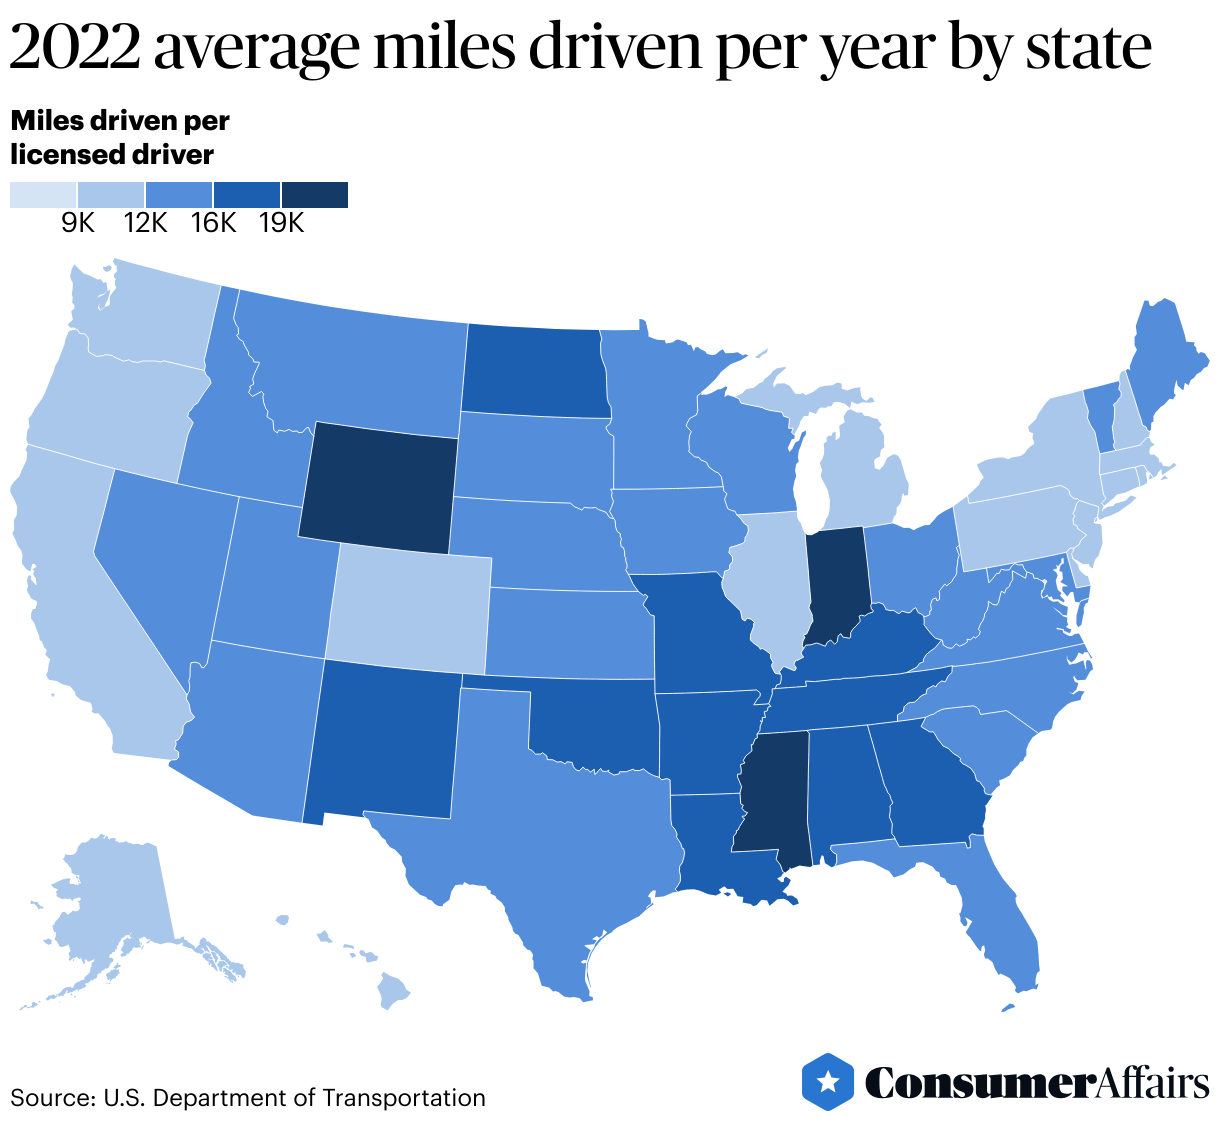
Jump to insightThe average driver in Wyoming drives more than in any other state, at 21,588 miles per year. Drivers in Washington, D.C., drive the least annually, at 6,695 miles.
Jump to insightThe number of licensed drivers over the age of 70 exceeded 34 million in 2022, 2.5 times the number of older U.S. drivers in 1994.
Jump to insightGeneral driving data
In the U.S., there are more than 235 million licensed drivers. Since 2005, this number has included more female than male licensed drivers. In 2022, there were almost 2.5 times as many registered drivers over the age of 70 (34 million) as there were in 1994 (15 million), the first year for which data is available about older drivers.
As of 2022, just over 94% of the driving-age population in the U.S. has a driver’s license. The average driver takes an average of 2.5 trips and spends about 60.2 minutes on the road per day. Drivers also report that 30.3% of their trips are for errands, 21.6% involved commuting to and from work, and 19.4% of trips are for social/pleasure purposes.
Miles driven data
In 2022, the average driver in the U.S. drove 13,596 miles. This breaks down to just over 37 miles per day and 1,133 miles each month. The chart below details the number of licensed drivers in the U.S. and the average number of miles driven each year since 2010.
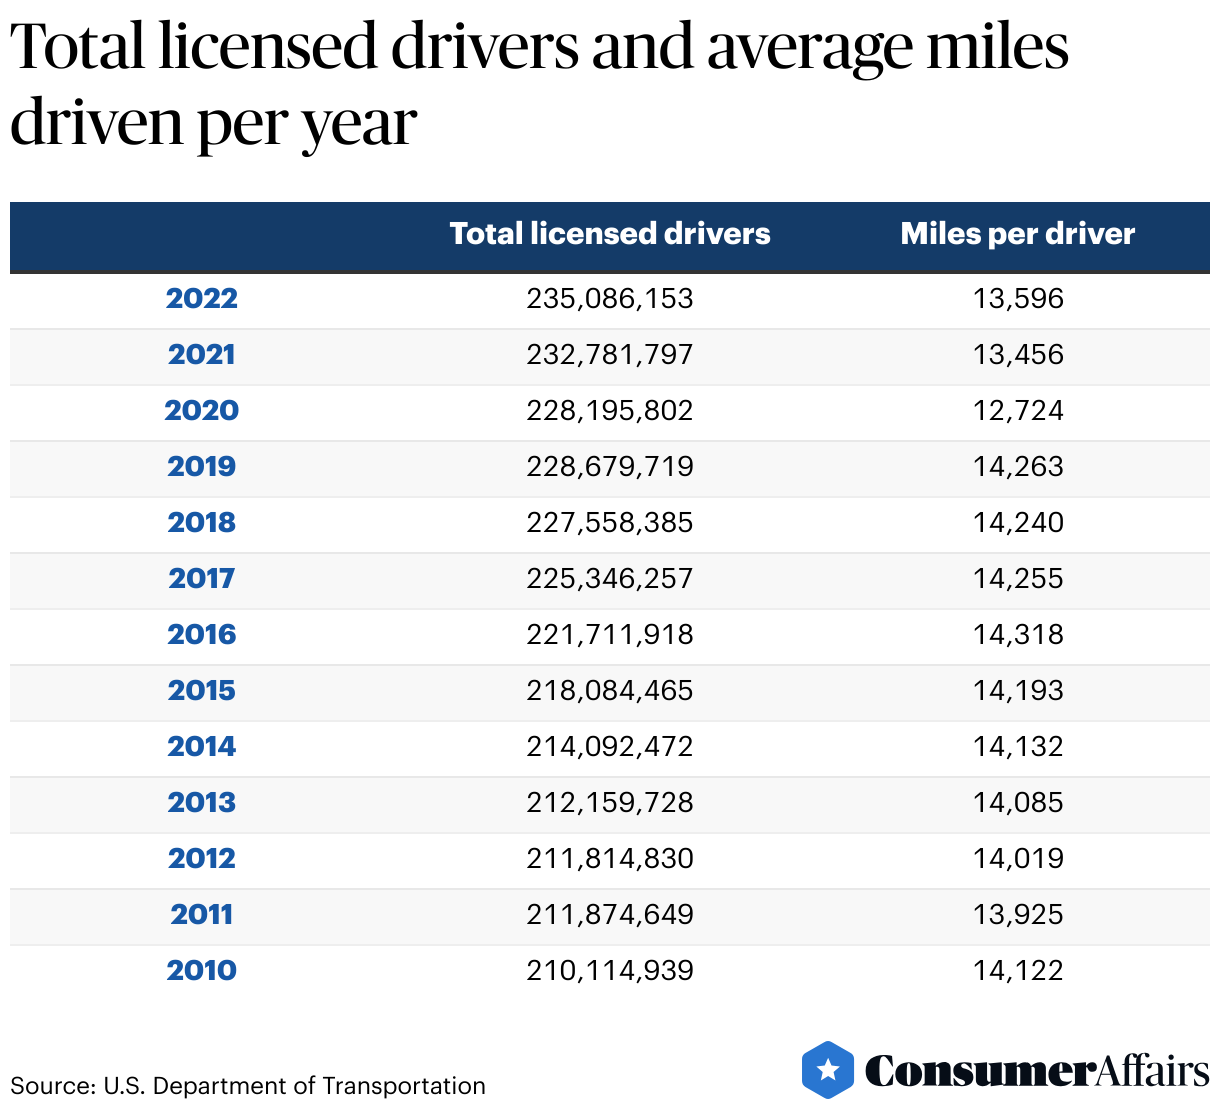
Historical miles driven by year
Historical data from the Federal Highway Administration shows that the total number of miles driven in the U.S. has generally increased year-over-year and decade-over-decade. Vehicle miles traveled increased by 37% over the course of the 1980s, 25% in the 1990s, 8% in the 2000s and another 10% between 2010 and 2019.
However, the total number of miles traveled fell dramatically in 2020 and has not rebounded to 2019 levels. The overall decrease in driving is likely due to a combination of COVID-19 pandemic restrictions and the subsequent trend toward remote work.
Miles driven by state
Drivers in Wyoming drive more miles than residents of other states — in 2022, the average state resident driver logged 21,588 miles behind the wheel. Indiana, Mississippi, Missouri and New Mexico also ranked in the top five states in terms of average miles driven. Residents of Washington, D.C., New York, Rhode Island and Washington, on the other hand, drove less than 10,000 miles, ranking lowest of the states in terms of average miles driven.
Five states with the highest average annual miles in 2025
The states with the highest average annual miles per driver also tend to be those where more miles are driven on rural roads rather than urban ones. In Wyoming, for example, 78% of vehicle miles are logged on rural roadways. In Indiana and Mississippi, respectively, rural mileage is 65% and 52%. In the vast majority of states, drivers travel more total miles on urban roads.
- Wyoming: 21,589 miles per year
- Indiana: 20,560 miles per year
- Mississippi: 19,517 miles per year
- Missouri: 18,514 miles per year
- New Mexico: 17,786 miles per year
Meanwhile, the five states with the lowest average annual miles in 2022 were:
- New York: 9,548 miles per year
- Washington: 9,819 miles per year
- Rhode Island: 9,903 miles per year
- Alaska: 10,510 miles per year
- Pennsylvania: 10,950 miles per year
Miles driven by age group
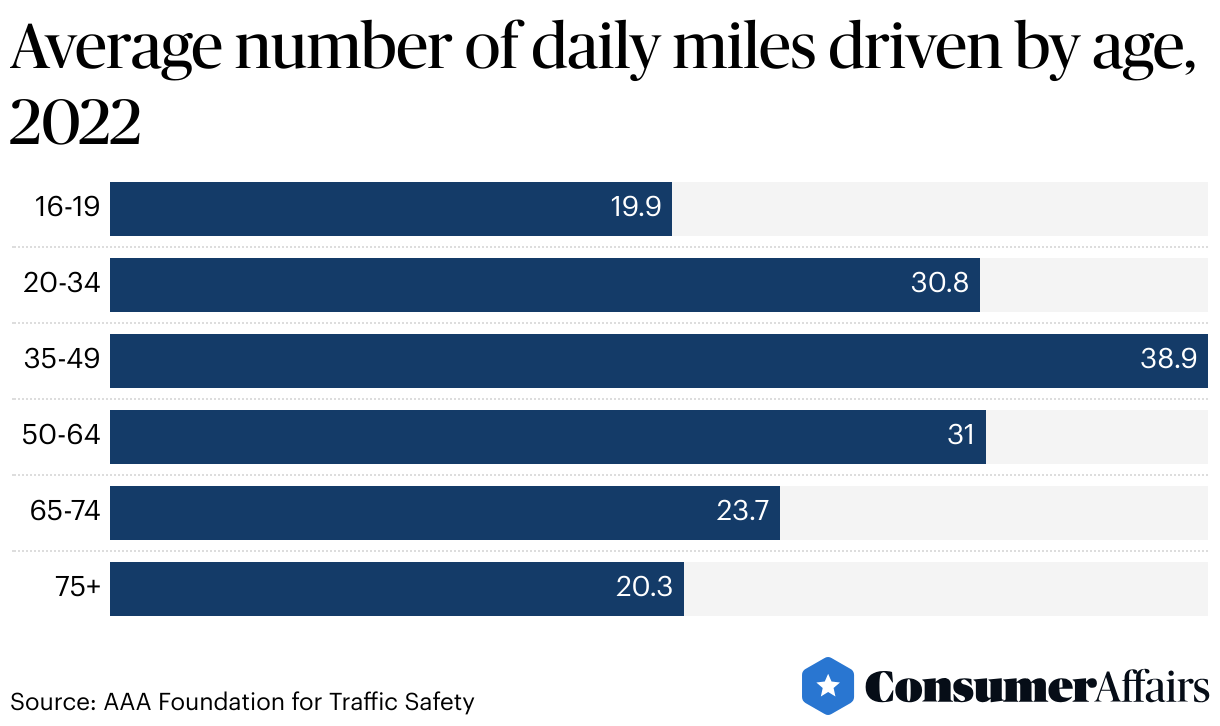
According to the AAA Foundation’s 2023 American Driving Survey, drivers between the ages of 35 and 49 report driving the most miles on a daily basis. Drivers over the age of 75 report driving fewer miles each day than drivers between 16 and 19.
Miles driven by gender
The American Driving Survey also shows that, on average, men report driving more than women, although the gap has narrowed in the three years for which data is available.
Average number of daily miles driven by gender from 2020 to 2022
| 2020 | 2021 | 2022 | |
|---|---|---|---|
| Male | 33.7 | 37.7 | 33.6 |
| Female | 23.7 | 27.8 | 26.7 |
FAQ
How much does the average person drive per month?
Each month in 2022, the average driver in the U.S. logged 1,133 miles. However, average driving totals can vary significantly between different parts of the country. The average driver in Wyoming drives 1,799 miles per month, while the same number is only 558 miles for the average driver in Washington, D.C.
What age group drives the most?
American Driving Survey data shows that drivers between the ages of 35 and 49 drive the most miles, logging an average of just under 39 miles a day. Drivers over the age of 75, and those between the ages of 16 and 19 drive the least, with both reporting around 20 miles a day.
How many hours does the average American drive a day?
On an average day, drivers in the U.S. report spending just over 60.2 minutes in their car. This number drops to 51.7 minutes on Saturdays, and rises to 55.5 minutes on Sundays.
Article sources
ConsumerAffairs writers primarily rely on government data, industry experts, and original research from other reputable publications to inform their work. Specific sources for this article include:
- U.S. Department of Energy: Alternative Fuels Data Center, “Annual Vehicle Miles Traveled in the United States.” Accessed July 16, 2025.
- U.S. Department of Transportation: Office of Highway Policy Information, “Highway Statistics 2022, Table DL-201” Accessed April 2025.
- U.S. Department of Transportation: Office of Highway Policy Information, “Highway Statistics 2022, Table DL-220.” Accessed April 29, 2025.
- U.S. Department of Transportation: Office of Highway Policy Information, “Highway Statistics 2022, Table VM-202.” Accessed Feb. 8, 2024.
- U.S. Department of Transportation: Office of Highway Policy Information,“Highway Statistics 2022, Table HM-44.” Accessed Jan. 18, 2024.
- AAA Foundation for Traffic Safety, “American Driving Survey: 2022.” Accessed Sept. 13, 2023.
- AAA Foundation for Traffic Safety, “American Driving Survey: 2023.” Accessed Sept. 27, 2025.
- Trusted Choice, “Average Miles Driven Per Year by State in 2025.” Accessed Sept. 27, 2025.
Figures