Male vs. Female Driving Statistics 2026
+2 more

There are more licensed female drivers in the U.S. than male drivers. But men nonetheless drive far more than women each year.
A disproportionate share of fatal traffic accidents involves male drivers, particularly when speeding or alcohol use is a contributing factor. Overall, male drivers were involved in over 72% of fatal car accidents in the U.S. in 2023.
Licensed female drivers have outnumbered their male counterparts since 2005. In 2022, there were just under 119 million licensed female drivers and over 116 million licensed male drivers.
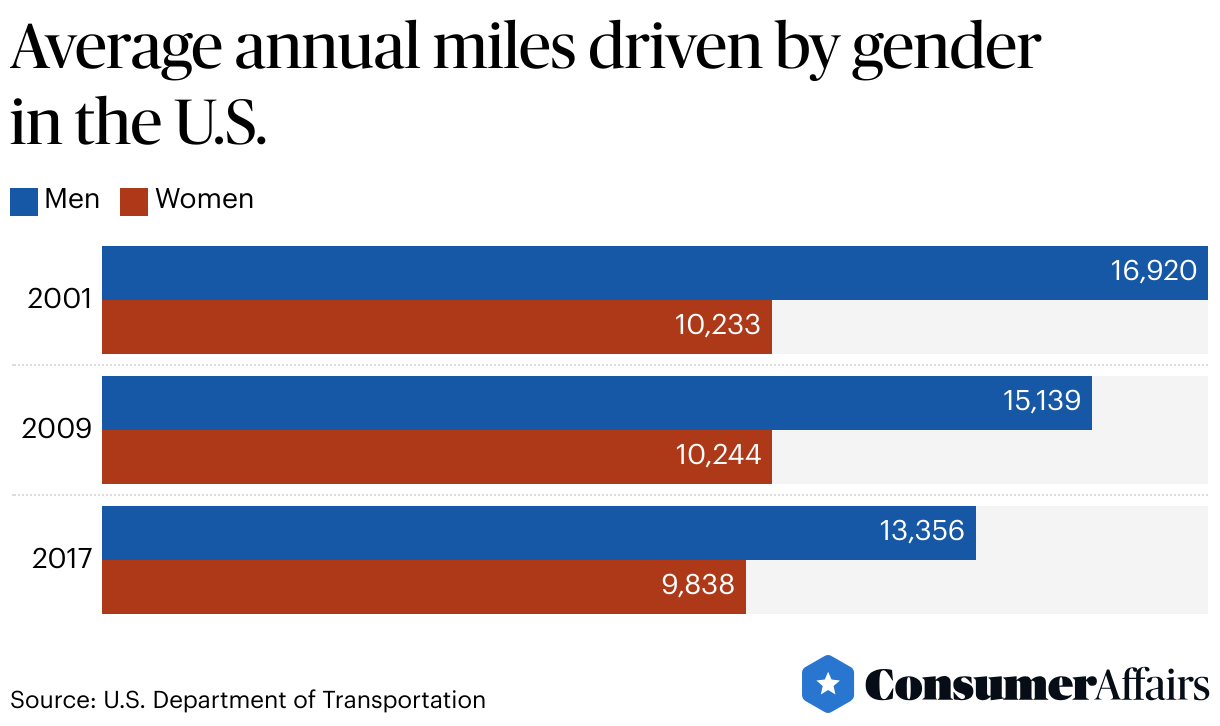
Jump to insightOn average, men drive about 16,550 miles and women around 10,142 per year, which is 39% fewer miles than men.
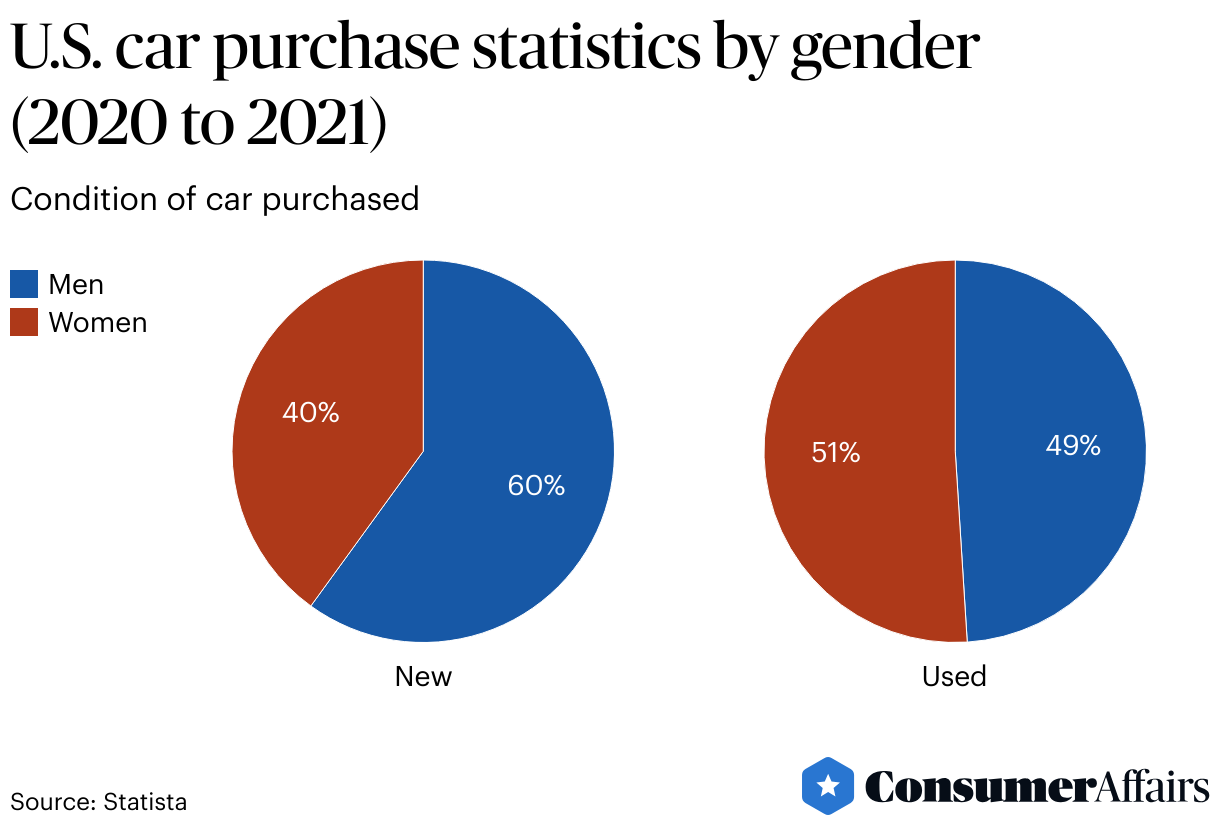
Jump to insightIn 2021, men purchased more new cars than women. However, women held a slight majority of used car purchases.
Jump to insightMale drivers account for about 72% of fatal car crashes in the U.S. Also, they are far more likely to be drivers in fatal crashes that involve speeding or alcohol use than women.
Jump to insightDriving demographics statistics
Registered female drivers have outnumbered male drivers in the U.S. since 2005. This makes sense, considering women and girls represent more than 50% of the U.S. population. However, the female population has outnumbered men in the U.S. since 1946, meaning it took more than half a century for America’s gender demographics to be reflected among the number of registered American drivers.
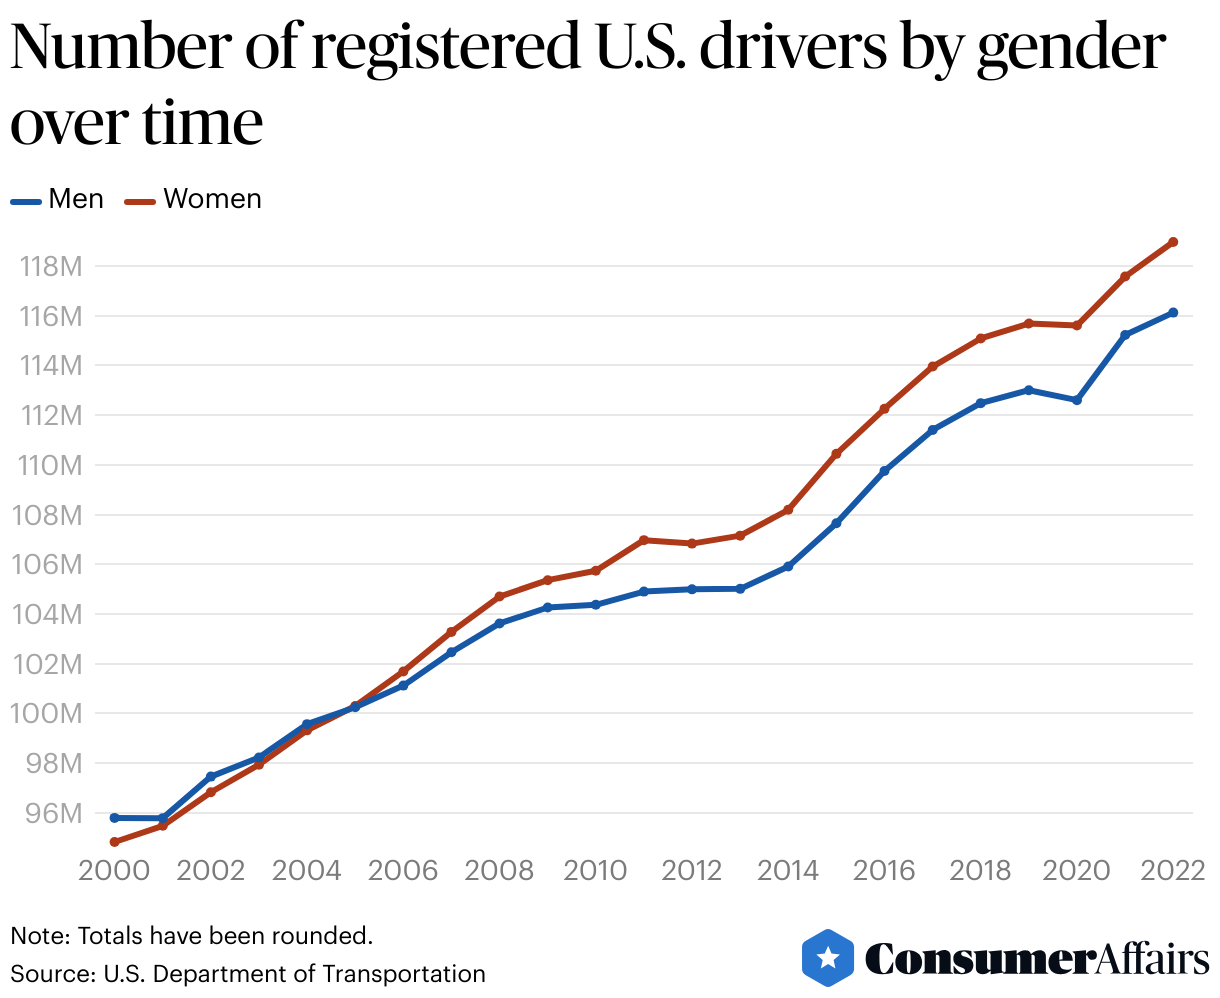
In 2022, there were more licensed female drivers than male drivers in every age group 30 years old or older.
Gender also impacts car insurance rates: While younger men are likely to pay higher rates due to riskier driving behaviors, some studies have shown that rates for women are higher once they reach the age of 35.
Which gender does the most driving?
According to the National Household Travel Survey (NHTS), men have historically done more driving than women, though this gap appears to be narrowing with time. According to 2017 data, American women drove about 26% less miles than American men.
While comparable data was not collected as part of the 2022 NHTS, that survey does indicate that men travel more miles per day on average than women (31 versus 26, respectively). However, those daily travel averages reflect all modes of transit, not just driving.
The 2022 NHTS does show that among drivers 50 years of age and older, men drive more than women. Among American men ages 50 and older, 94% were drivers, and they drove an average of 28 miles per day. Among American women ages 50 and older, 93% were drivers, and they drove an average of 21 miles per day.
The 2022 NHTS also shows that in their category, more men drive than women. In 2022, 77% of American men and 75% of women were drivers.
New and used car sales by gender
Car sales statistics suggest that gender plays a role in the type of vehicle purchased by car buyers. Men make up the majority of new car buyers, while women hold the slight majority of used car buyers. Used cars make up about three-quarters of all car sales in an average year.
Motor vehicle crashes by gender
Male drivers are significantly more likely to be involved in fatal car accidents than female drivers. In 2021, male drivers accounted for just over 74% of fatal U.S. car crashes. The same holds true over the past 25 years, as male drivers were involved in roughly three-quarters of all fatal crashes annually.
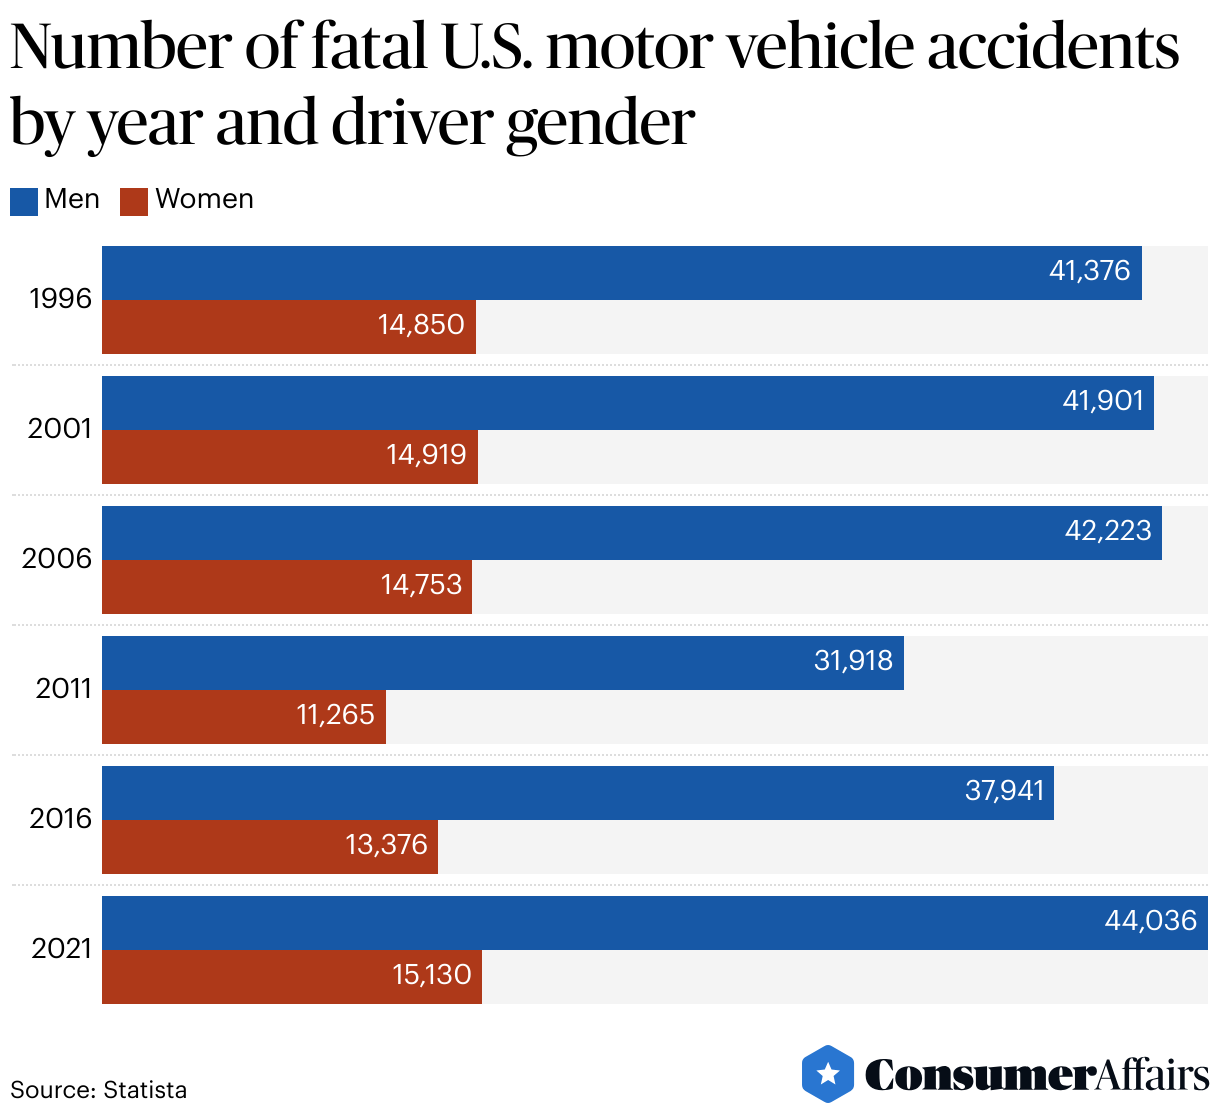
Drivers of both genders have experienced an uptick in fatal crashes since 2011. Overall, the number of drivers involved in fatal crashes increased by 37% between 2011 and 2021. Fatal crashes involving male drivers were up by nearly 38% over this period, while fatal crashes involving female drivers rose by over 34%.
What are the most common fatal crashes by gender?
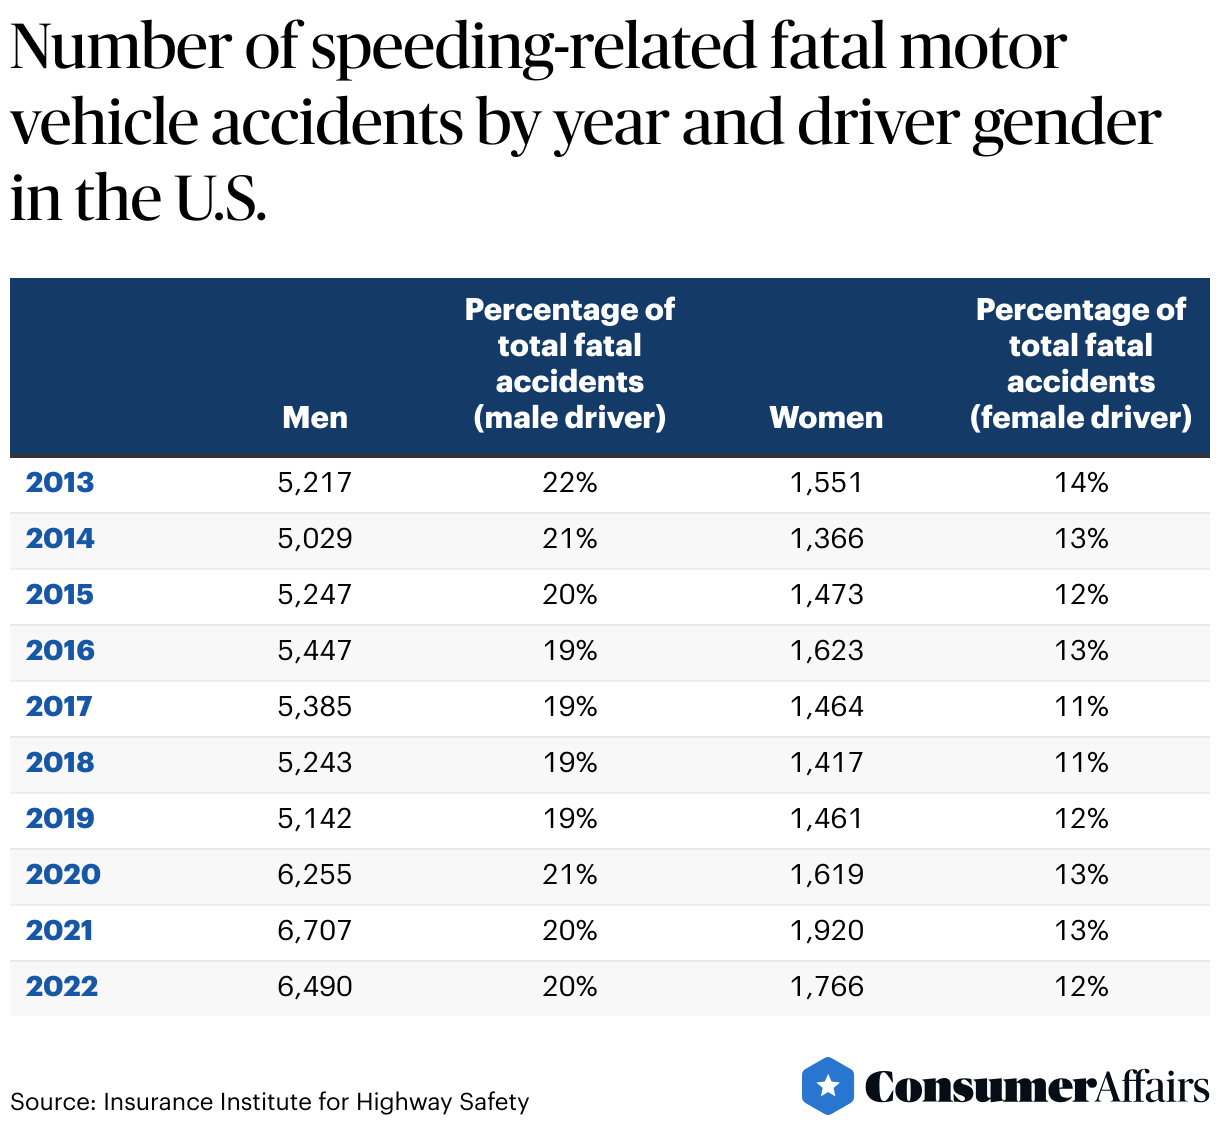
Among the reasons that men are more likely than women to be involved in fatal crashes is their likelihood to engage in riskier driving practices, such as speeding and driving while under the influence of alcohol. In 2022, 20% of male drivers involved in a fatal car accident were speeding, while the same was true for only 12% of female drivers.
Drunk driving statistics by gender
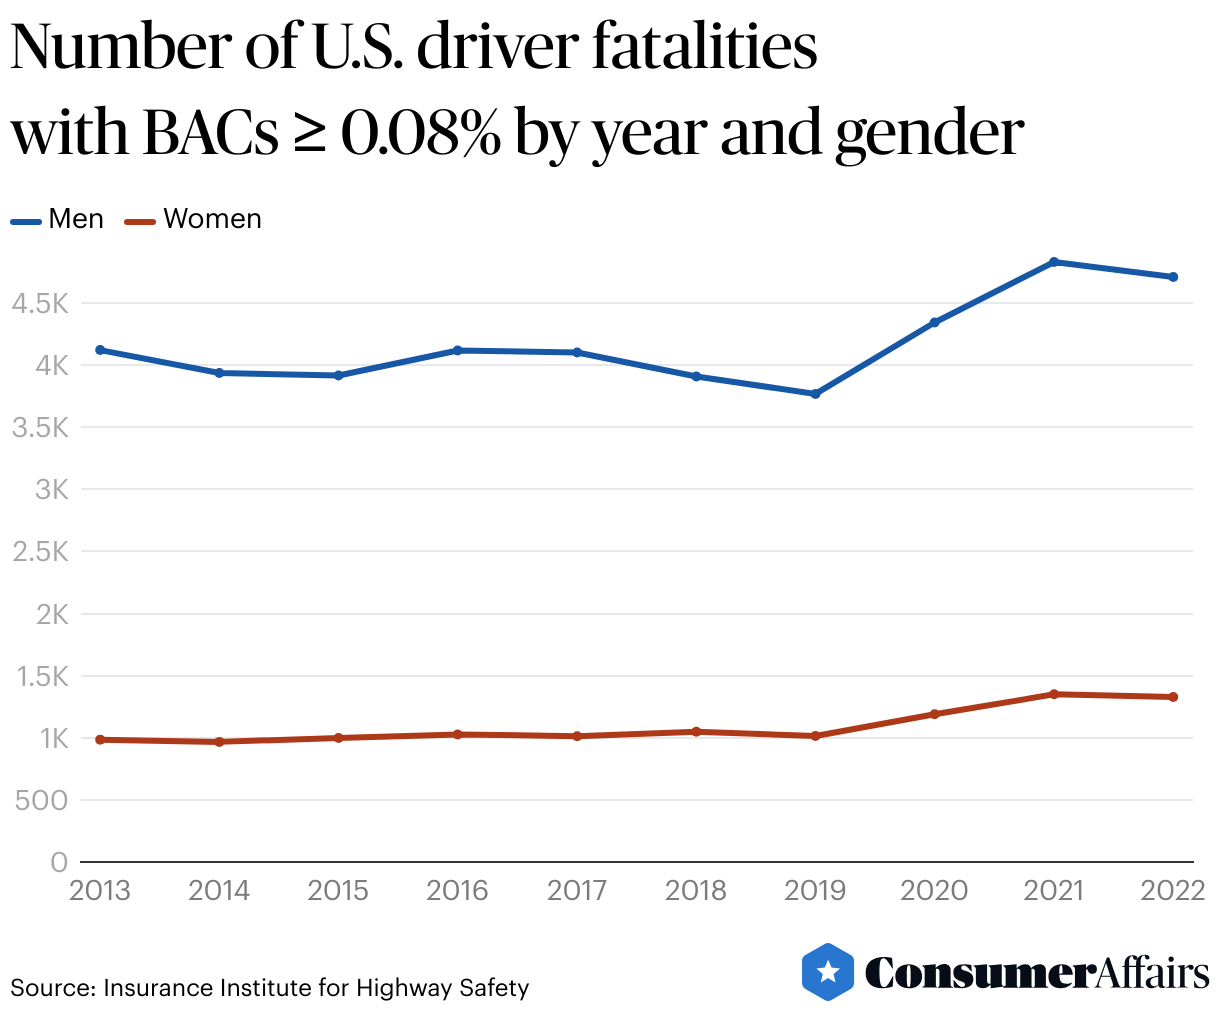
Similarly, male drivers are much more likely than female drivers to be killed in car accidents involving alcohol. In 2022, 4,709 male drivers who died in motor vehicle accidents had a blood alcohol concentration (BAC) of 0.08% or higher. The corresponding number for female drivers was only 1,328.
FAQ
Do men or women cause more fatal car accidents?
Male drivers are involved in significantly more fatal car accidents than women. Even when miles driven are taken into account, men have a higher likelihood of being behind the wheel in a fatal accident.
Who are the most dangerous drivers?
Fatal car crash rates are particularly high for male drivers ages 16 to 19. American drivers in this demographic have a fatal crash rate that is more than three times higher than the rate for all drivers.
Do men or women drive more?
On average, men drive more miles than women. In 2017, American men drove an average of 16,550 miles each year, while American women drove an average of 10,142 miles, a difference of about 39%.
Article sources
ConsumerAffairs writers primarily rely on government data, industry experts, and original research from other reputable publications to inform their work. Specific sources for this article include:
- U.S. Department of Transportation, “Average Annual Miles per Driver by Age Group.” Accessed June 21, 2024.
- U.S. Department of Transportation, “New and Used Passenger Car and Light Truck Sales and Leases.” Accessed June 22, 2024.
- U.S. Department of Transportation, “National Household Travel Survey.” Accessed June 22, 2024.
- U.S. Department of Transportation, “Summary of Travel Trends: 2022 National Household Travel Survey.” Accessed June 22, 2024.
- U.S. Department of Transportation, “Highway Statistics 2022, Table DL-220.” Accessed June 22, 2024.
- U.S. Department of Transportation, “Transportation Statistics Annual Report 2023.” Accessed June 22, 2024.
- Statista, “Distribution of new and used car buyers in the United States in 2021, by gender.” Accessed June 22, 2024.
- Statista, “Number of drivers involved in fatal crashes in U.S. road traffic from 1996 to 2021 by sex.” Accessed June 22, 2024.
- Insurance Institute for Highway Safety, “Fatality Facts 2023: Males and females.” Accessed June 22, 2024.
- USAFacts, “Population by gender.” Accessed June 22, 2024.
Figures