The best states for Halloween
+2 more
From massive candy hauls to nail-biting horror movies, people of all ages can find something to enjoy on Halloween. But for many, it’s not enough to celebrate just once a year — some want the spooky season to last 365 days a year.
While celebrating year-round may not be realistic, there are some standout states where Halloween lovers can get the most out of the holiday season. If you want to move to a state that's as into Halloween as you are, there are a few frighteningly festive options for you to consider.
To identify the most Halloween-obsessed states, the ConsumerAffairs Research Team developed a “Terror Tally,” ranking each state on Halloween attractions and eerie online activity. Keep reading to see where your state lands.
For the second year in a row, New Hampshire ranks as the most Halloween-obsessed state, driven by its high number of pumpkin patches and Spirit Halloween stores per capita.
Jump to insightKentucky leads the nation in haunted attractions per capita, making it a top destination for thrill-seekers and ghost enthusiasts alike.
Jump to insightVirginia saw the biggest jump in the nation, climbing 33 spots to No. 5, thanks to surging search interest in Halloween music and pumpkin spice lattes.
Jump to insightHawaii ranked dead last for Halloween excitement, held back by its few spooky attractions and residents’ limited online interest.
Jump to insight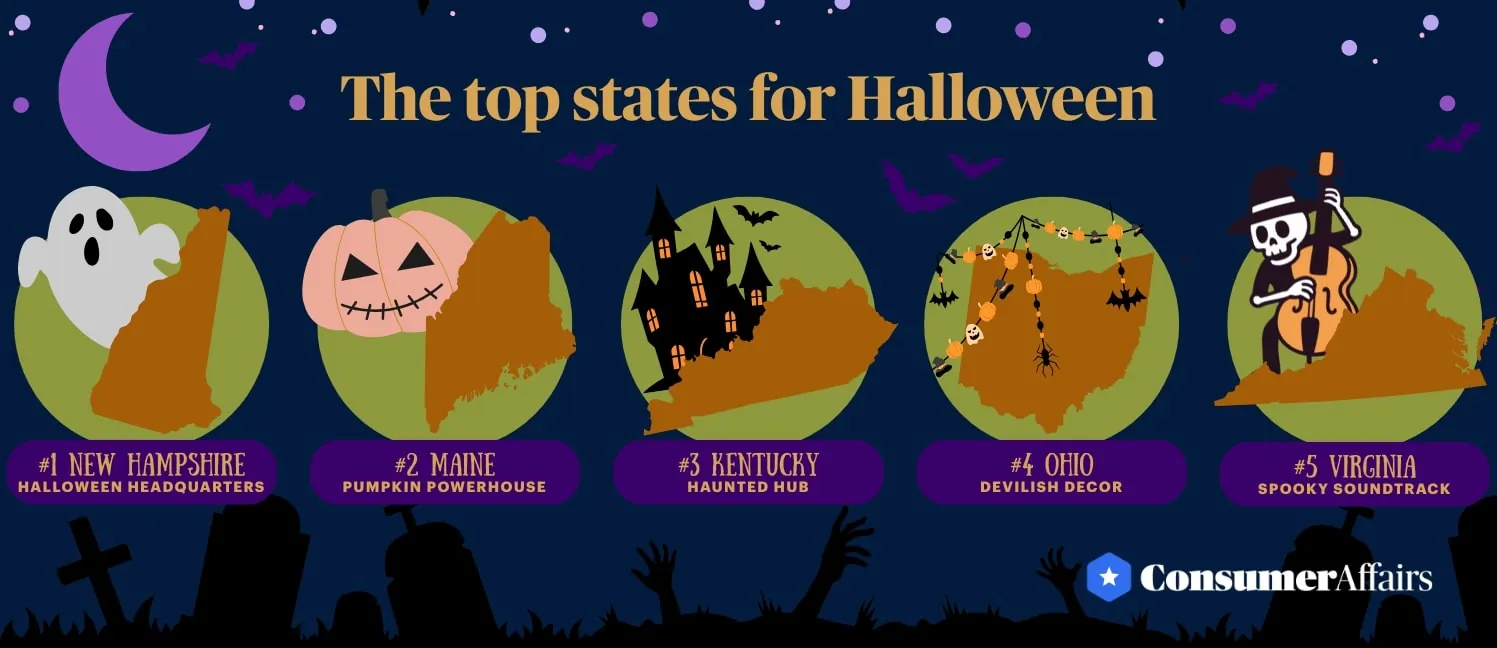
The most Halloween-obsessed states
There’s no one right way to celebrate Halloween, and our top five states prove that. Whether it’s Maine’s multitude of pumpkin patches or Virginia’s obsession with Halloween music, each state has a unique approach to the spooky season.
However, all of our top five states have one thing in common: an autumnal atmosphere, including a moody chill and fall foliage in the later months of the year. Conversely, Hawaii ranked at the bottom of our list, indicating that warmer temperatures and tropical vibes may not inspire residents to take part in Halloween activities.

1. New Hampshire
New Hampshire topped our list for the second year in a row, which is no surprise given that it has the highest number of Spirit Halloween stores per capita. The state will even be home to a new concept — Spirit Christmas — in the city of Salem later this year.
The Granite State also boasts the second-highest number of pumpkin patches per capita. In fact, one of New Hampshire’s patches once produced a 2,528-pound pumpkin, which broke the record for the largest pumpkin ever recorded in U.S. history.
2. Maine
The Pine Tree state is near the top of our list, possessing the highest number of pumpkin patches per capita. However, visitors this season may be less than impressed with the selection, as many pumpkin patches are reporting smaller-than-average harvests due to an exceptionally dry summer.
Stephen King readers will not be surprised that Maine ranks high on our list, given that the state is a setting for many of the horror writer’s novels, such as “It,” “Pet Sematary” and “Cujo.” King’s fictional town of Derry, Maine, is also the setting for the upcoming “It” prequel series, “Welcome to Derry.”
3. Kentucky
The first state in our ranking outside of New England, Kentucky is jam-packed with spooky spots, boasting the highest number of haunted attractions per capita. Prominent haunted attractions include the Waverly Hills Sanatorium in Louisville and the Old Talbott Tavern in Bardstown.
Kentuckians also bring the haunts back home — the state has a high volume of searches on Halloween decorations, indicating that residents like to celebrate the holiday wherever they are.
4. Ohio
Just up north, Ohio ranks as fourth on our list. Much like its neighbor Kentucky, the state has a large number of haunted locales, such as Face Your Fears Hotel of Terror in Springfield and Fear Columbus in the capital, as well as nationally recognized haunted houses like Factory of Terror in Canton and The Dent School House in Cincinnati.
Additionally, Ohio has a sweet tooth, ranking near the top of our list for searches about Halloween candy. However, residents of the Buckeye State may face sticker shock when they buy their favorite treats, as the price of chocolate has increased due to extreme weather and supply chain issues.
5. Virginia
Virginia rounds out our top five because of its interest in terrifying tunes: The state has the highest search volume for Halloween music in the nation, with a score that more than triples the next-highest ranking state, Ohio.
The state also ranks high in searches for pumpkin spice lattes, which helped it make the leap from last year’s ranking of No. 38. Perhaps the extra caffeine will help residents keep up their energy throughout the season.
States with the best (and worst) Halloween spirit, ranked
Two other Great Lakes States, Indiana and Pennsylvania, made it into our top 10, while Southern states including Mississippi, Georgia, Alabama and Louisiana ranked lowest for spooky spirit. Check out the Terror Tally to see where your state falls:

Methodology
To determine the top Halloween hot spots, the ConsumerAffairs Research Team analyzed 10 metrics related to Halloween-themed online activity and local Halloween attractions. We used population data from the U.S. Census Bureau to calculate rates per 1 million people in each state for the Halloween attractions.
The best-performing state for each of the individual metrics received the maximum number of points, and all other states were assigned points based on how they compared relative to the best-performing state. We added the scores together to calculate an overall “Terror Tally” score out of 100 points.
Halloween-related local attractions (60 points):
- Number of haunted attractions per 1 million residents: 20 points
- Number of pumpkin patches per 1 million residents: 20 points
- Number of Spirit Halloween stores per 1 million residents: 20 points
Local attraction data is from The Scare Factor (2025), PumpkinPatches.com (2025) and Spirit Halloween (2025).
Halloween-related online activity (40 points):
- Halloween music search volume on YouTube: 15 points
- Google search volume for the following terms: 4.17 points each
- Halloween decorations
- Halloween costumes
- Halloween movies
- Pumpkin spice latte
- Halloween crafts
- Halloween candy
Online activity data is from Google Trends and represents average weekly search interest from Sept. 22, 2024, through Sept. 22, 2025.
Reference policy
We love it when people share our findings! If you do, please link back to our original article to credit our research.
Questions?
For questions about the data or if you'd like to set up an interview, please contact rsowell@consumeraffairs.com.
Article sources
ConsumerAffairs writers primarily rely on government data, industry experts and original research from other reputable publications to inform their work. Specific sources for this article include:
- Google, “Google Trends.” Accessed Oct. 2, 2025.
- The Scare Factor, “Haunted House Directory.” Accessed Oct. 2, 2025.
- U.S. Census Bureau, “Table S0101 - Age and Sex.” Accessed Oct. 2, 2025.
- PumpkinPatches.com, “Pumpkin Patches.” Accessed Oct. 2, 2025.
- Spirit Halloween, “Halloween & Costume Stores.” Accessed Oct. 2, 2025.
- USA Today, “Too early for Santa Claus? Spirit Christmas to open 30 stores. See where, when.” Accessed Oct. 2, 2025.
- Time, “New Hampshire Man Grows the Largest Pumpkin in North American History.” Accessed Oct. 2, 2025.
- News Center Maine, “Beloved fall tradition tested by one of the driest summers on record.” Accessed Oct. 2, 2025.
- Screen Rant, “Every Stephen King Story Set in Derry.” Accessed Oct. 2, 2025.
- Screen Rant, “Stephen King's $1.1 Billion Horror Franchise Officially Returns This Month.” Accessed Oct. 2, 2025.
Figures