Annual Cost to Commute by Metro (2026)

+1 more

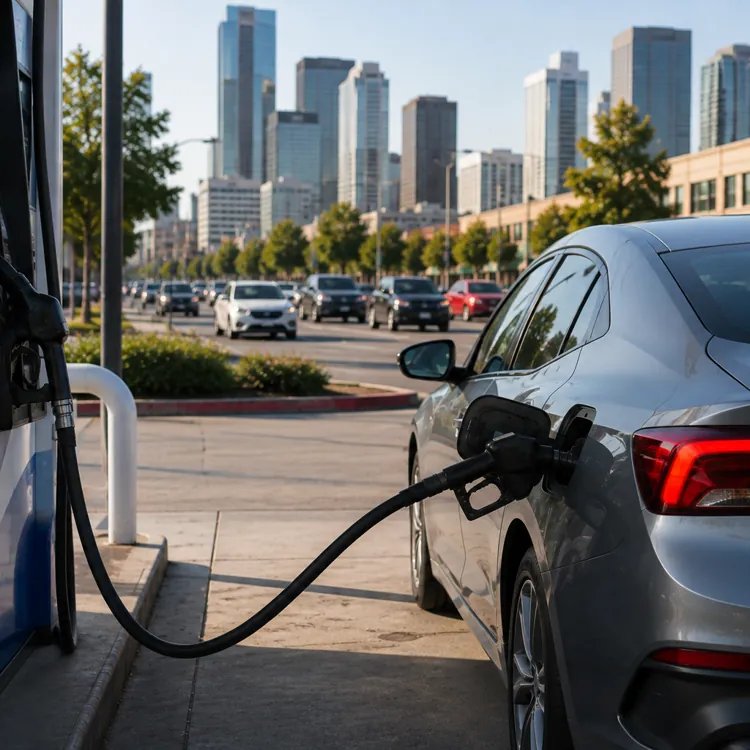
What drivers spend at the pump is only one part of what it costs to get to work. The larger financial burden is often the unpaid time workers spend traveling to and from their jobs each day. Over a year, those hours — combined with fuel costs — can add up to thousands of dollars.
Consider a typical worker with an eight-hour shift and a 30-minute commute each way. That employee effectively dedicates nine hours of the day to work but is paid only for eight. Over a full year of in-person work, those unpaid hours can represent thousands of dollars in lost earning potential — before factoring in fuel, vehicle wear and tear, or unexpected repairs that may not be covered by an extended auto warranty.
The ConsumerAffairs Research Team analyzed data from the 100 largest U.S. metro areas to estimate the annual cost of commuting. We combined the estimated value of time spent commuting — based on average round-trip commute times and state-level median hourly wages — with estimated annual fuel costs based on average gas prices, commute distance and fuel economy.
Nationally, the average commute costs workers about $6,770 per year in lost time and gas.
Jump to insightThe San Francisco metro area has the most expensive commute in the U.S., costing workers $10,902 per year.
Jump to insightThe New York City metro area ranks No. 4 for commute costs and has the longest average round-trip commute, at 71.2 minutes per day.
Jump to insightFour of the 10 most expensive metros for commuting are in California, where drivers also face the highest gas prices in the U.S.
Jump to insightMidsize metros tend to have lower commute costs. Of the 100 metros on our list, McAllen, Texas, has the nation’s most affordable commute, at $4,303 per year.
Jump to insightMetros with the most expensive car commutes
The most expensive metros for commuting share several traits: dense populations, high median wages and steep gas prices, with many concentrated along the West Coast and in the Northeast.
Evelyn Blumenberg, a professor of urban planning and director of the Lewis Center for Regional Policy Studies at UCLA, said that as metro areas have developed, workers who want to buy a home have accepted a trade-off: less expensive housing farther from city centers in exchange for longer-distance commutes — which often means more time spent in vehicles.
Ultimately, “metro area size, congestion, mode (of transport) and characteristics of workers” are all strongly associated with commute times, Blumenberg said.
Check the map below to see the most and least expensive metros for commuting, and read on for more details about the top five costliest on the list.

1. San Francisco, California
Annual commute cost: $10,902
The San Francisco-Oakland-Fremont metro area tops the list with an average annual commute cost of $10,902. California drivers face gas prices of $5.65 per gallon, bringing estimated annual fuel costs to $1,643, the highest in the U.S.
The San Francisco metro area ranks second in the other category we measured: the cost of workers’ commuting time. With an average round-trip commute of 62 minutes per day, workers, who have median wages of $35.70 per hour, give up approximately 259 hours per year — the equivalent of nearly 11 full days. As tech companies and other employers increasingly mandate a return to the office, commuting creates a significant financial and time burden for the Bay Area workforce.
2. San Jose, California
Annual commute cost: $10,636
The San Jose-Sunnyvale-Santa Clara metro area ranks No. 2, with an average annual commute cost of $10,636. California’s $5.65-per-gallon gas price and San Jose’s median hourly wage of $40.41 — highest in the U.S. — make even its below-average 53.2-minute round-trip commute expensive. The uncompensated time cost reaches $8,993 annually, third highest nationwide.
San Jose workers spend more than 222 hours in transit each year — more than nine full days. The metro’s inflation-adjusted commute costs rose 30.4% over the past decade, the second-largest increase among the 100 metros. For workers seeking housing outside the core of Silicon Valley, that daily travel is an important cost to consider.
3. Washington, D.C.
Annual commute cost: $10,493
The Washington-Arlington-Alexandria metro area ranks No. 3, with an average cost of $10,493 per year. Gas is only slightly more expensive than average; workers’ time is the larger cost factor. In fact, the D.C. metro costs commuting workers more in lost time annually ($9,260) than any other area in the U.S.
With an average round-trip commute of 64.8 minutes, workers give up approximately 271 hours per year — more than 11 full days. The combination of lengthy commutes and high wages makes time an especially expensive part of getting to work in the nation’s capital.
4. New York, New York
Annual commute cost: $10,026
The New York-Newark-Jersey City metro area ranks No. 4, with an average annual commute cost of $10,026. It has the country’s longest average round-trip commute, at 71.2 minutes per day. Over a year, workers in the metro spend more than 297 hours getting to work — the equivalent of more than 12 full days.
Combined with a median wage of $29.53 per hour, that commute creates an uncompensated time cost of $8,796 annually. Average gas prices of $4.23 per gallon add another $1,230. Although many people in the region rely on public transit, those who commute by car face heavy traffic and high fuel costs. For workers considering housing in outlying areas, daily travel becomes an important part of the calculation.
5. Seattle, Washington
Annual commute cost: $10,018
The Seattle-Tacoma-Bellevue metro area rounds out the top five, at $10,018 per year. Workers in the metro average 58.4 minutes of round-trip travel per day, adding up to more than 244 hours — or more than 10 full days — annually.
Average gas prices of $5.12 per gallon bring estimated annual fuel costs to $1,489, third highest in the U.S. Time spent commuting costs workers, who make a median hourly wage of $34.91, another $8,529. Seattle’s inflation-adjusted commute costs have risen 24.8% over the past decade as the region’s population and economy have expanded.
The least expensive metros for commuting
At the other end of the list, McAllen, Texas, has the nation’s least expensive commute, at an average of $4,303 per year. Midsize metros often pair shorter travel times with lower gas prices. McAllen workers, for example, spend 45 minutes per day on their round-trip commute, while gas in Texas averages $3.64 per gallon.
The bottom of the ranking also shows a clear regional pattern: All 10 of the least expensive metros are in the South or Midwest, and each has gas prices below the $4.10 national average. Shorter travel times help, too. Wichita, Kansas, has the shortest average round-trip commute of all 100 metros, at just 40 minutes per day, helping it rank third-least expensive overall.
The 10 most affordable commuting metros are:
- McAllen, Texas
- El Paso, Texas
- Wichita, Kansas
- Toledo, Ohio
- Greenville, North Carolina
- Tulsa, Oklahoma
- Omaha, Nebraska
- Jackson, Mississippi
- Little Rock, Arkansas
- Greensboro, North Carolina
How do commuting costs vary across the U.S.?
Commuting costs reveal a clear regional divide. The most expensive metros are mostly concentrated in the Northeast and on the West Coast, while the least expensive are mainly in the Midwest and South.
Costs can vary significantly within the same state. Houston ranks as the nation’s 25th most expensive metro for commuting, at $7,004 per year, compared with just $4,889 in El Paso, which has the second-lowest cost. These differences are due to commute times and local wages.
Where people live in relation is an important factor. “Most workers do not work in employment centers. Jobs are very dispersed,” Blumenberg, the urban planning professor at UCLA, said. While lower housing costs can sometimes offset the expense of longer commutes, she noted that those trips can carry other costs, including less time for family or exercise.
How has commuting changed over the past decade?
After adjusting for inflation, the average annual cost of commuting increased 17.2% between 2014 and 2024.
The increase varied considerably by metro, with California accounting for three of the four largest jumps. Stockton-Lodi recorded the largest increase, at 41.2%, followed by San Jose (30.4%), Fresno (30.2%) and Charleston-North Charleston, South Carolina (30.1%). New Orleans was the only metro where commuting became less expensive, with costs falling 2.6%.
How has remote work changed commuting?
Remote work has reshaped commuting since the pandemic. From 2019 to 2024, the share of the U.S. workforce working from home nearly tripled, from 5.2% to 15.1%, reducing the number of days many workers need to commute.
Washington, D.C., saw the largest increase in remote work among the metros analyzed, with its work-from-home share rising from 5.9% in 2019 to 25.4% in 2024. Austin, Texas, has the largest share of its workforce working from home, at 26.8%, followed by Raleigh-Cary, North Carolina, at 26.2% and San Francisco, at 25.8%.
For some hybrid workers, longer commutes have been more acceptable because they only have to make the trip a few days a week. As a result, some are choosing to live farther from their jobs than they would if they had to commute every day, according to Blumenberg.
“They might now live further from their workplaces than previously but still must live within striking range,” she said.
Methodology
The ConsumerAffairs Research Team analyzed the 100 largest U.S. metro areas to estimate the annual cost of commuting. Estimated annual commuting costs combine two components:
- Time costs: The estimated annual value of time spent commuting, based on average one-way commute time (U.S. Census Bureau), doubled for a round trip, and multiplied by 251 workdays and the median hourly wage in each metro area (U.S. Bureau of Labor Statistics). This accounts for the opportunity cost of commuting — workers typically aren't paid for time spent traveling to and from work, but that time is still required as part of an in-person workday.
- Fuel costs: The estimated annual cost of gasoline for a typical commute, based on a national average one-way commute distance of 13.56 miles for privately owned vehicles (Federal Highway Administration), average fuel economy of 23.4 mpg (FHWA) and average state gas prices as of July 30, 2026 (AAA).
For additional context, we conducted supplemental research that does not factor into the rankings. This includes a 10-year comparison of commuting costs between 2014 and 2024, as well as metrics on remote work.
For the supplemental 10-year cost comparison:
- Time costs: We used median earnings for 2014 and 2024 (U.S. Census Bureau), converted to an hourly equivalent. U.S. Census data was used because comparable BLS metro-level wage estimates were not available for several of the largest metros in 2014.
- Fuel costs: We used AAA state gas prices for July 2014 and July 2024, along with the commute distance and fuel economy figures (FHWA) corresponding to each year.
- Inflation: Time costs were adjusted using the general consumer price index, and fuel costs were adjusted using the gasoline index, both to 2024 dollars.
Because BLS and U.S. Census Bureau earnings data measure different populations, current-year rankings and historical cost estimates should not be directly compared.
This analysis estimates costs for a typical commuter and does not account for differences in vehicle type, fuel efficiency, tolls, parking, maintenance, insurance or public transportation use. We used national average commute distances because comparable metro-level estimates are not publicly available.
Reference policy
We love it when people share our findings! If you do, please link back to our original article to credit our research.
Questions?
For questions about the data or if you'd like to set up an interview, please contact egomes@consumeraffairs.com.
Article sources
ConsumerAffairs writers primarily rely on government data, industry experts and original research from other reputable publications to inform their work. Specific sources for this article include:
- U.S. Census Bureau, "Explore Census Data." Accessed Aug. 27, 2026.
- U.S. Bureau of Labor Statistics, "Occupational Employment and Wages." Accessed Aug. 27, 2026.
- U.S. Bureau of Labor Statistics, "Occupational Employment and Wage Statistics." Accessed Aug. 27, 2026.
- AAA Fuel Prices, "Fuel Prices." Accessed Aug. 27, 2026.
- U.S. Bureau of Labor Statistics, "Top Picks." Accessed Aug. 27, 2026.
- Bureau of Labor Statistics, "Consumer Expenditure Survey." Accessed Aug. 27, 2026.
- Federal Highway Administration, "Highway Statistics Series." Accessed Aug. 27, 2026.
- Federal Highway Administration, "National Household Travel Survey." Accessed Aug. 27, 2026.
- The Tennessean, "United States Gas Price History." Accessed Aug. 27, 2026.
Figures