The U.S. cities with the worst holiday traffic
+2 more
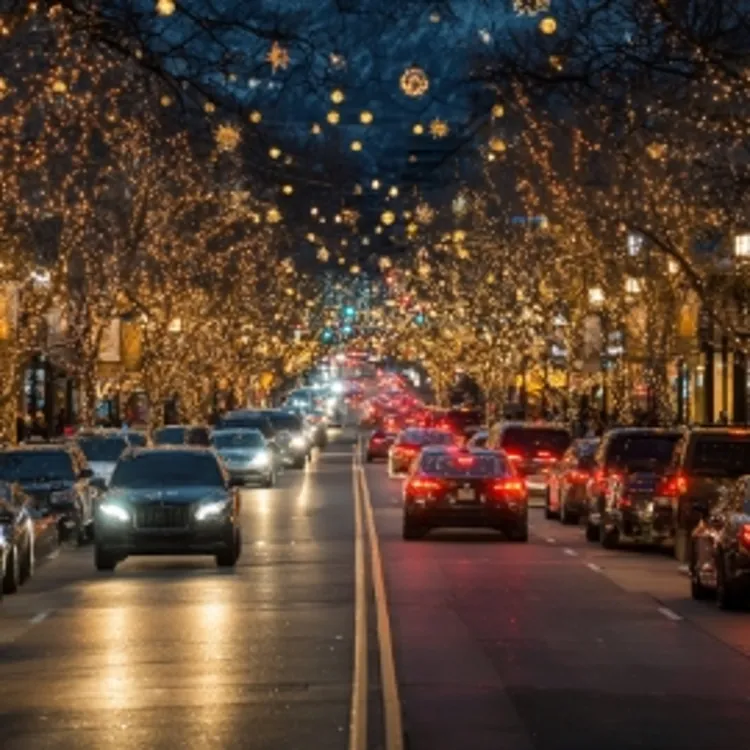
Trying to make it home for the holidays? There’s nothing like a sea of taillights to have you seeing red on the way to your destination.
Across the country, millions of Americans are gearing up for holiday travel and bracing for the annual surge of seasonal traffic. Last year, 107 million people were expected to travel by car during the holidays, which was 90% of all travelers last year and just shy of 2019’s record of 108 million. The 2025 holiday season could be even bigger: More than half of Americans plan to travel between Thanksgiving and early January, the largest share in recent years.
More traffic doesn’t just mean a slower journey; it can also be more expensive. More fuel is required to navigate stop-and-go traffic or highway idling. You may want to invest in protecting your car before hitting the road amid the influx of seasonal travelers, too.
If you’re getting behind the wheel this holiday season, it helps to know where you might see the biggest surge in traffic. To find out, ConsumerAffairs evaluated major U.S. cities based on changes in traffic volume, congestion and fatal crashes. Whether you’re planning a road trip over the river and through the woods or just hoping to keep spirits bright on your typical commute, read on to learn more about the worst cities for holiday traffic.
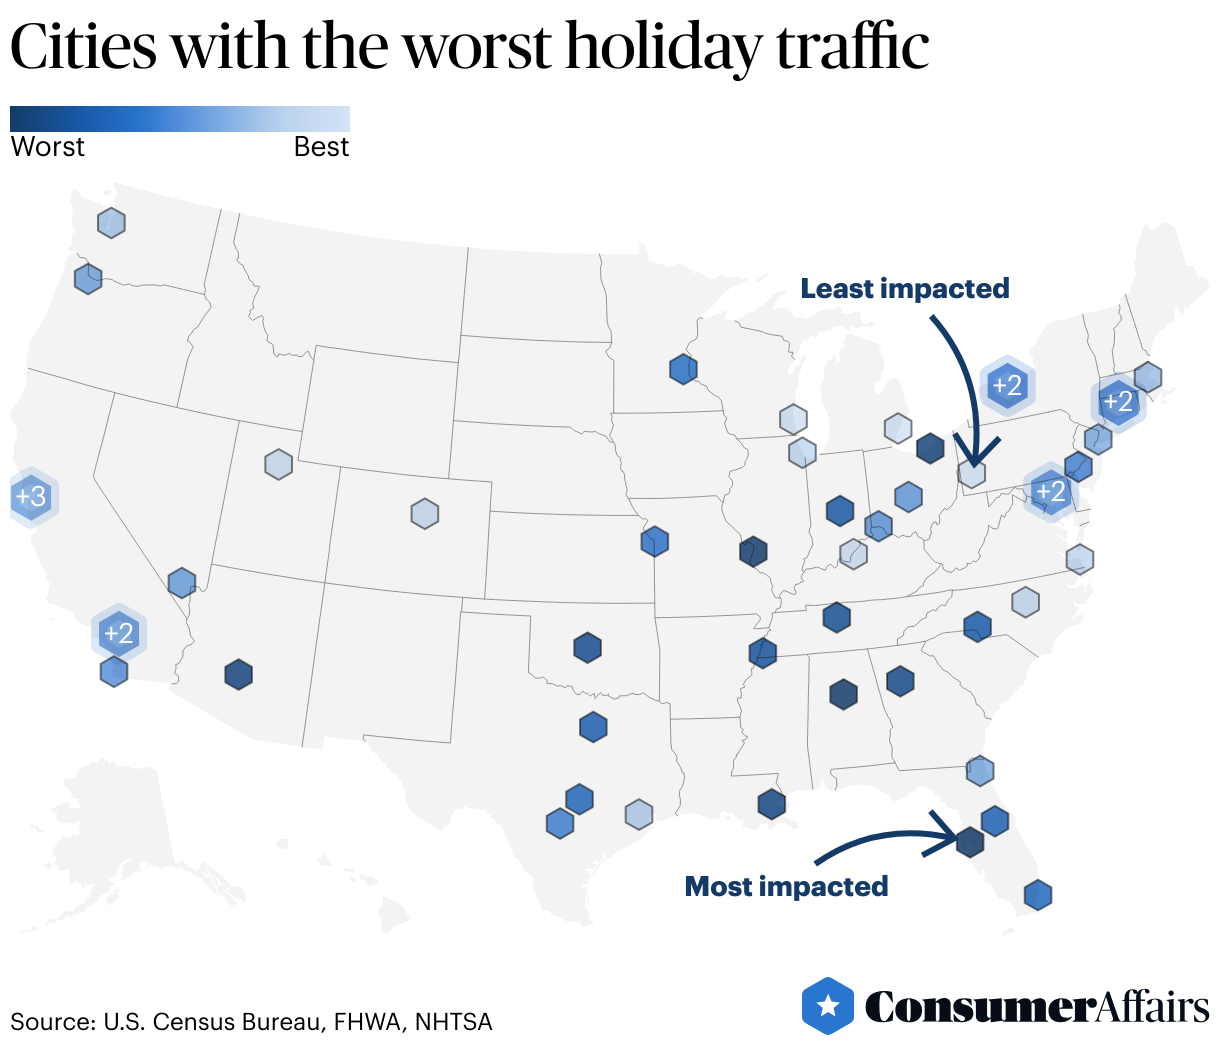
Tampa ranks worst overall for holiday traffic surges, with congestion up 36% and volume up 24% from the rest of the year.
Jump to insightDespite relatively low congestion, Birmingham ranks among the worst for holiday traffic due to a sharp seasonal congestion spike and high traffic volume.
Jump to insightWhile they face significant traffic year-round, major metros like New York City, Los Angeles and San Francisco didn’t see sharp increases in holiday traffic in 2024.
Jump to insightMemphis has the highest number of deadly crashes on clear days, with more than 28 fatal crashes per 1 million people.
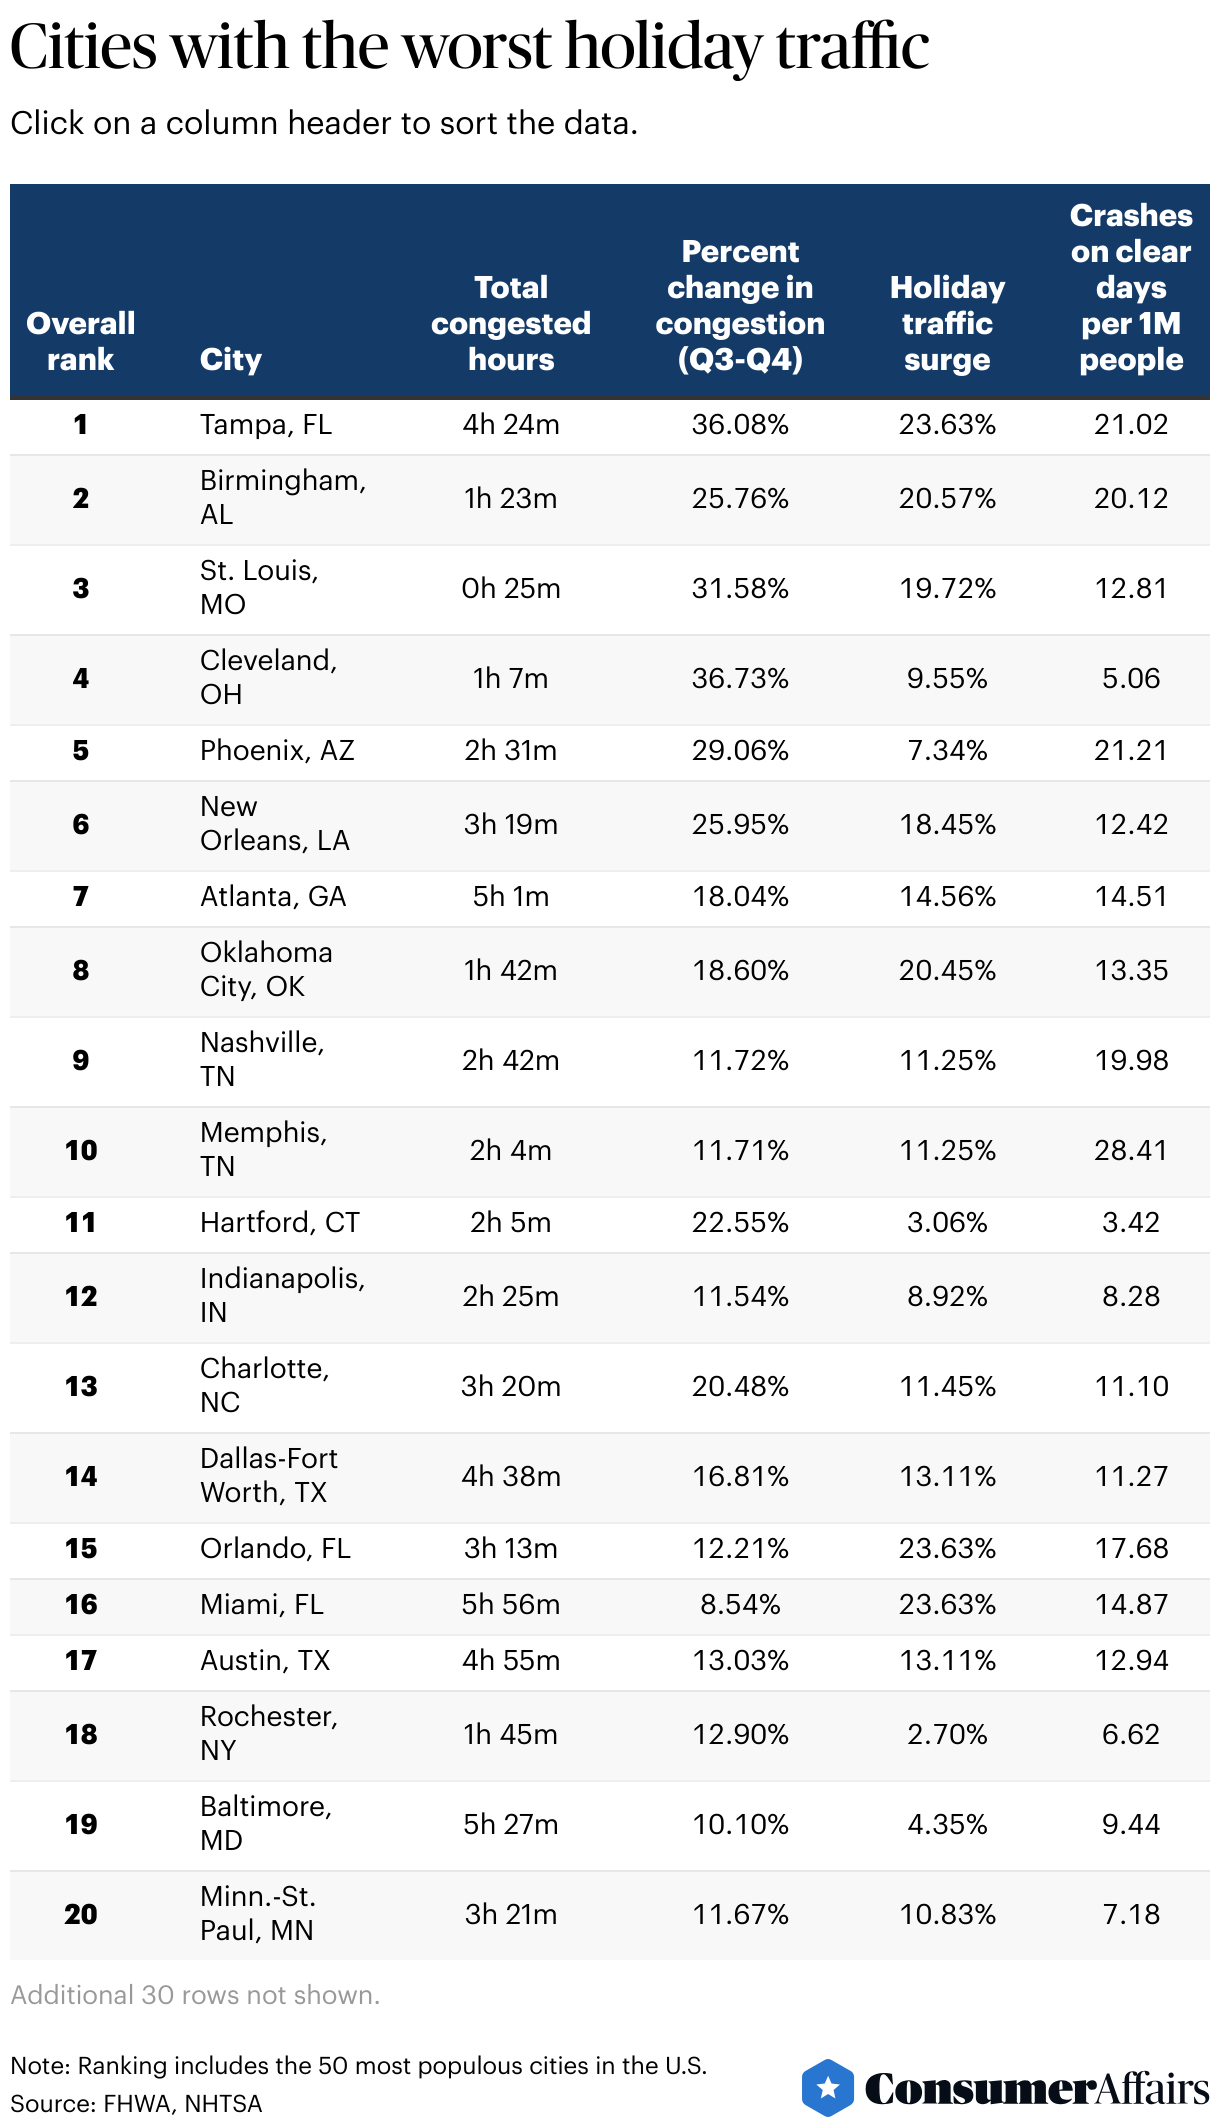
Jump to insightFive cities with the worst holiday traffic
Holiday traffic jams can arise for myriad reasons, from snowstorm-induced slowdowns to increased congestion as motorists hit the road for seasonal errands and outings. But where do drivers feel the biggest crunch?
Among the five cities that rank worst overall, the average amount of congestion varies widely, from less than an hour to over 5 hours a day. But what these cities have in common — and a key factor in their ranking — is that they saw a significant surge in congestion from Q3 (July, August and September) to Q4 (October, November and December) in 2024.
Traffic volume (reflected by daily miles driven) varies across these cities, too, but three of the top five exhibit extremely sharp spikes during the holiday months.
Check out the map for a bird’s eye view of the cities where holiday traffic presents the biggest headache. Then, read more about each of the top cities below.
1. Tampa, Florida
Our methodology put Tampa, Florida, at the No. 1 spot for worst holiday traffic. A significant contributing factor is the city’s huge jump in traffic congestion. From Q3 to Q4 in 2024, congestion worsened by 36%, and that’s the second-largest increase in the country.
To make matters worse, Tampa drivers may not be the nicest folks to get stuck with during a traffic jam. Florida ranks as one of the worst states for road rage.
Drivers in Tampa also log significant miles during the holiday season — on average, it’s 27.6 miles per driver per day during November and December, the fourth highest in the country. But even more noteworthy? When “the most wonderful time of year” comes around, Tampa sees the largest spike in miles driven: a 24% increase compared with the rest of the year.
Tragically, Tampa has a high rate of fatal crashes on clear-weather days. With about 21 fatal crashes per 1 million people, it ranks third worst for this sobering metric.
During the holidays:
- Congestion duration: 4 hours, 24 minutes
- Daily traffic volume: 27.6 miles per driver (fourth highest)
- Fatal crashes on clear days: 21 per 1 million people (third highest)
- Weather-related fatal crashes: 4.7 per 1 million people
2. Birmingham, Alabama
When it comes to major American cities, Birmingham lands on the smaller side — with a population of about 1.2 million people, it’s one of the smallest we compared for this study. But smaller stature doesn’t mean Birmingham is spared from big-time traffic: The “Magic City” ranks second worst overall for traffic during the holidays.
Its standout stat? Birmingham drivers log the most miles per capita during the holiday season of any city we analyzed: 33 miles a day.
It’s worth noting that Birmingham actually has a comparatively low traffic threshold. It ranks the third lowest for overall traffic congestion in both Q3 and Q4. However, it has one of the sharpest increases in congestion as autumn transitions into the holiday season (26%, the sixth-largest increase).
While Birmingham sees a surge of holiday-season traffic, there are some bright spots. For one, if you’re a Yellowhammer State motorist, you might be more likely to hit a traffic jam than a pothole: Alabama has some of the best roads in the country. An impressive 97% of the state’s urban roads and 99% of its rural roads are in good or acceptable condition.
During the holidays:
- Congestion duration: 1 hour, 23 minutes
- Daily traffic volume: 33 miles per driver (highest)
- Fatal crashes on clear days: 20.1 per 1 million people (fifth highest)
- Weather-related fatal crashes: 6.7 per 1 million people (ninth highest)
3. St. Louis, Missouri
Ranking third worst for holiday traffic is St. Louis, Missouri: “The Gateway to the West.” Year-round, St. Louis actually has some of the most manageable traffic in the country. In particular, it boasts the least congestion of all the cities we compared. Even during the holiday season, the city sees just 25 minutes of congestion each day.
Congestion may be lower in St. Louis than in other cities, but that might not mean much to the Missourians living there. When the end of the year rolls around, residents see traffic congestion jump by 32% — that’s the third largest increase in the country.
And congestion isn’t the only issue: Motorists also experience significant traffic volume as year-end draws near. St. Louis drivers log an average of 27.7 miles a day during November and December. That’s the third-highest distance in the country and a sizable jump from the rest of the year (almost 20%).
During the holidays:
- Congestion duration: 25 minutes
- Daily traffic volume: 27.7 miles per person (third highest)
- Fatal crashes on clear days: 12.8 per 1 million people
- Weather-related fatal crashes: 3.2 per 1 million people
4. Cleveland, Ohio
Like St. Louis, the other Midwestern city in the top five, Cleveland has fairly low traffic year-round. It has some of the briefest congestion during the holiday season, at just over an hour a day. But, like the other top-ranking cities, Cleveland made the list because it sees such a significant spike during the holidays. In fact, it’s the city where congestion worsens the most: 36.7% from Q3 to Q4.
Thankfully, this congestion doesn’t come with a steep increase in dangerous road events. Despite the uptick in holiday traffic, Cleveland remains one of the safer cities for holiday-season motorists: It ranks in the bottom 10 cities for deadly crashes on clear-weather days and in the bottom third for fatal weather-related crashes.
During the holidays:
- Congestion duration: 1 hour, 7 minutes
- Daily traffic volume: 20.8 miles per person
- Fatal crashes on clear days: 5.1 per 1 million people (ninth lowest)
- Weather-related fatal crashes: 2.8 per 1 million people
5. Phoenix, Arizona
Phoenix rounds out the top five, bringing some unique attributes along with it. “The Valley of the Sun” is the lone Western city in the top five ranks. (It’s also the only Western city in the top 20; the West is more represented in the back half of the rankings.)
Phoenix is also more populous than the other top-ranking cities. With nearly 5.2 million residents, it’s the 10th-largest city in America.
Larger cities can mean more traffic, and that’s true for Phoenix — especially during the holidays. The city sees the fourth-largest increase in congestion, increasing by 29% from Q3 to Q4. Traffic volume is significant, too: Drivers log 21.8 miles a day during the holiday season. This is only a moderate 7.3% increase from the rest of the year.
Phoenix is also among the worst cities for fatal crashes during the holiday season, with a rate of 21.2 crashes per 1 million people. That’s the second-highest rate in the country.
During the holidays:
- Congestion duration: 2 hours 31 minutes
- Daily traffic volume: 21.8 miles per driver
- Fatal crashes on clear days: 21.2 per 1 million people (second highest)
- Weather-related fatal crashes: 5 per 1 million people
The worst holiday traffic isn't always in the biggest cities
As you check out the data, these rankings may come as a surprise — some of America’s largest metros land lower on the list despite having earned big reputations for congestion and traffic jams. After all, in our latest analysis of cities with the worst traffic overall, Los Angeles, New York and San Francisco all landed in the top 10. So why didn’t any of them make the top five for holiday traffic?
It’s actually because these cities have such snarled traffic year-round that they didn’t land in the top ranks. Our methodology was designed to emphasize increases in traffic around the holidays, not just identify the cities with the worst traffic volume or congestion.
Los Angeles, for example, averaged more than 7 hours of congestion each day in Q4 — the longest-lasting in the country. However, that was only a 6% increase from Q3, a far cry from the 32% jump in St. Louis, Missouri, during the same period.
It’s a similar story for New York and San Francisco — both cities rank in the top 10 for congestion duration, but the spike in congestion around the holiday season was only about 10% in 2024.
The bottom line? In some cities, traffic is so tough year-round that the marginal holiday-season increase registers little more than a blip. Keep all this in mind as you dive into the city-by-city breakdown below.
How does holiday traffic impact road safety?
Of course, traffic isn’t just an inconvenience. In some cases, the holiday rush also makes the roads more dangerous. Take Memphis, Tennessee, for instance. The city ranks 10th overall for the worst holiday traffic, but it tops the list for deadly crashes on clear-weather days, with 28.4 fatal crashes per 1 million people. (Unfortunately, this metric isn’t an anomaly for the Bluff City: In other studies, we found that Memphis has the most dangerous drivers in America.)
Most of the cities that rank among the top 10 for worst holiday traffic also rank in the top half of states for fatal crashes. However, this pattern isn’t present in every city we analyzed. Consider Louisville, Kentucky, which ranks in the bottom five cities for holiday traffic overall but has the seventh-highest rate of fatal crashes on clear-weather days. Or Virginia Beach, Virginia: The city has the lowest rate of deadly crashes on clear-weather days and ranks in the bottom 10 overall, but it has the highest rate of fatal weather-related crashes (13.9 crashes per 1 million people).
How does your city rank for holiday traffic?
Ultimately, the data tells a unique story for each metro. Check out the chart below to see how your city compares.
Methodology
To identify the cities with the worst holiday traffic, the ConsumerAffairs Research Team analyzed the 50 most populous U.S. metropolitan areas across four weighted metrics:
- Hours of congestion during the holidays (65 points): We examined data from the Federal Highway Administration’s Urban Congestion Report (2024). Using July to September congestion as a baseline, we compared congestion in October through December to determine the percentage change and identify cities with the largest holiday spike.
- Miles traveled during the holidays (15 points): Data came from the FHWA HM-71 report (2023). We calculated the change in miles traveled from a baseline period (August to October) to November and December to measure holiday travel surges. We also included miles traveled per capita.
- Fatal crashes on clear days (10 points): We used data from the National Highway Traffic Safety Administration’s Fatality Analysis Reporting System (2023) to track deadly crashes occurring in clear weather. We calculated per-capita rates using 2024 population data from the U.S. Census Bureau.
- Fatal crashes in bad weather (10 points): Also from NHTSA FARS (2023), this metric tracks deadly crashes during weather events. Population data is also from the U.S. Census Bureau for the per-capita calculation.
For each metric, the city with the highest rate received the maximum score, and others were scored relative to that top performer. All category scores were added to produce an overall score out of 100 points.
Reference policy
We love it when people share our findings! If you do, please link back to our original article to credit our research.
Questions?
For questions about the data or if you'd like to set up an interview, please contact jrodriguez@consumeraffairs.com.
Article sources
ConsumerAffairs writers primarily rely on government data, industry experts and original research from other reputable publications to inform their work. Specific sources for this article include:
- Federal Highway Administration, Quarterly Urban Congestion Reports. Accessed Nov. 16, 2025.
- Federal Highway Administration, Travel Monitoring. Accessed Nov. 16, 2025.
- Federal Highway Administration, Highway Statistics 2023. Accessed Nov. 16, 2025.
- National Highway Traffic Safety Administration, Fatality and Injury Reporting System Tool (FIRST). Accessed Nov. 16, 2025.
- AAA, Record Number of Holiday Travelers Expected to Close Out 2024. Accessed Nov. 16, 2025.
- Deloitte, 2025 Deloitte Holiday Travel Survey. Accessed Nov. 16, 2025.
- U.S. Department of Energy, Driving More Efficiently. Accessed Nov. 16, 2025.
Figures