Cities With the Best Public Transit (2026)

+1 more

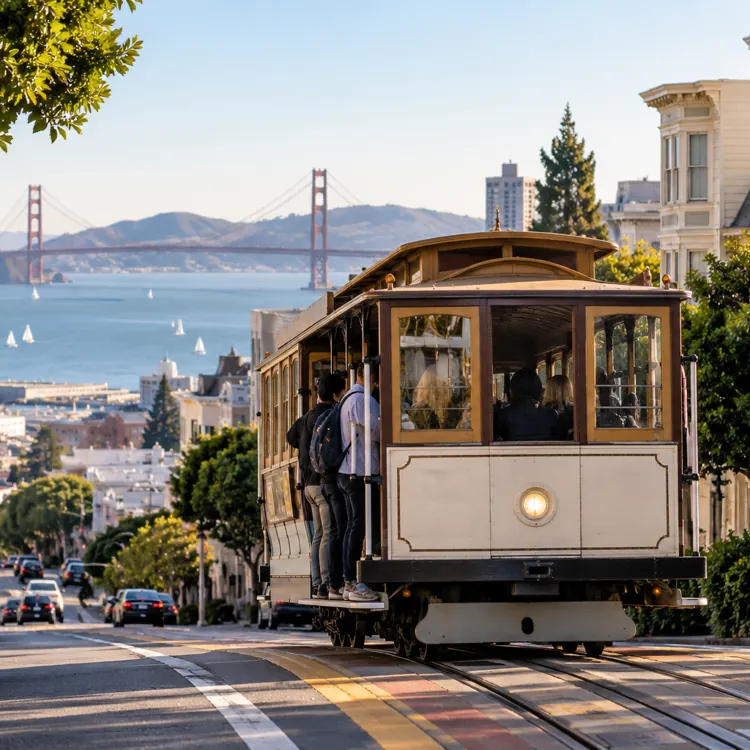
Most Americans just can’t part with their cars. In 2024, 69.2% of workers drove solo to jobs, while only 3.7% took public transportation, according to the U.S. Census Bureau. Still, ridership is climbing. Americans took 7.7 billion public transit trips in 2024, up 24% from 2022, per the American Public Transportation Association (APTA).
If you’re planning a move, keep in mind that strong transit isn’t only a New York or Washington, D.C., thing. Some of the best systems are in cities that might surprise you. Beyond getting you around, good transit can lighten the hit to your wallet. An APTA analysis suggested riders can save more than $13,000 a year by swapping driving for transit.
To find the cities with the best public transit, the ConsumerAffairs Research Team analyzed the 50 largest U.S. urban areas using the latest federal data. We looked at usefulness and accessibility, affordability, and operational safety to find the cities offering the strongest overall combination of transit benefits.
Key insights
San Francisco-Oakland has the best public transit in the U.S., with the second-highest ridership per resident in the country, and strong operational safety.
Jump to insightNew York-Jersey City-Newark ranks No. 2 for public transit. It leads the nation in ridership, but its affordability and safety scores are both outside the top 20.
Jump to insightThe Western U.S. has six of the 10 best cities for public transit, the most of any region in the country.
Jump to insightMiami and Houston are among the five largest urban areas in the U.S., yet neither appears in the top 15 for public transit.
Jump to insightAmong the 50 largest urban areas, Oklahoma City ranks last for public transit, with the average resident boarding transit about three times in 2024.
Jump to insightThe best cities for public transportation
According to Paul Goyette, a research project manager at the University of South Florida Center for Urban Transportation Research, the best transit systems share three key traits:
- Safety: The system must be secure, so people feel safe using it.
- Reliability: Buses and trains need to run on time, with good frequency and smooth transfers between routes.
- Customer service: Riders should feel heard when something goes wrong, and drivers play a big part in that. “They need to be trained correctly to be able to de-escalate potential situations that can lead to elevated interactions,” Goyette said. “Drivers also need to have the mindset of being a customer service expert.”
No city leads the pack in every category of our analysis. San Francisco-Oakland secures first place without the cheapest fares. New York leads the nation in ridership, yet is far from being the safest system. Raleigh, North Carolina, posts the best affordability and safety scores in the country, but ridership numbers there are low.
Four of our top five cities also rank among the most expensive metros in the country for driving to work. In places where driving comes at a premium, a strong transit system is a meaningful financial alternative.
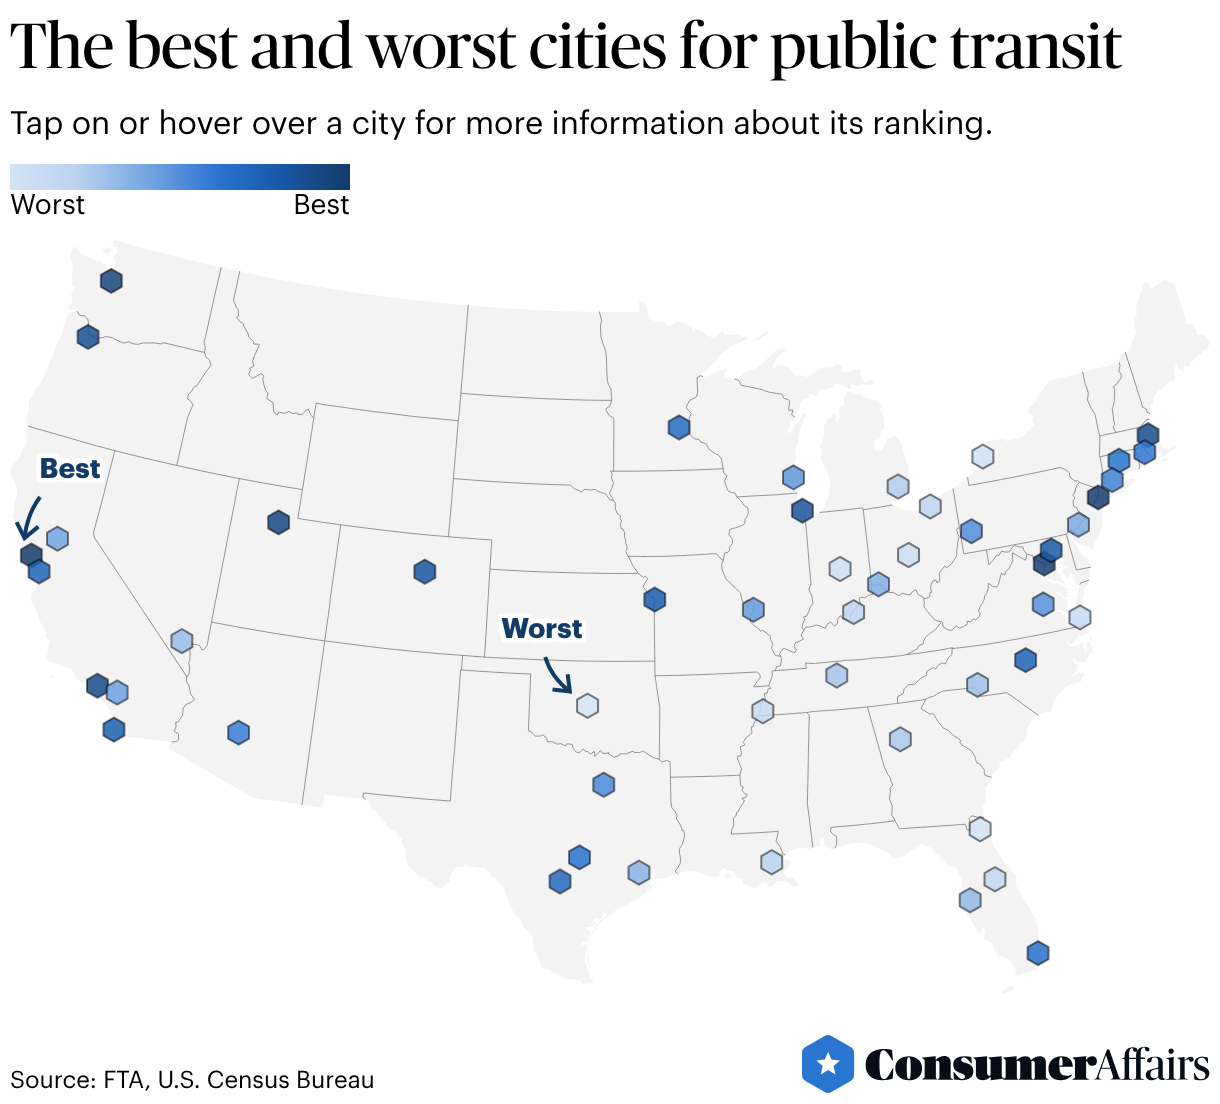
See how all 50 cities in our analysis compare below, and scroll down further to get an in-depth view of the top five:
1. San Francisco-Oakland, California
No single metric explains San Francisco-Oakland’s No. 1 ranking. The area is second nationally for boardings per resident, with the average person living in the Bay Area boarding transit about 83 times a year, and second in passenger miles per resident, trailing only New York in both.
San Francisco-Oakland and New York diverge in accessibility: 97% of stations in San Francisco-Oakland are compliant with the Americans with Disabilities Act, compared with about half of New York’s.
It’s also relatively more affordable to ride mass transit in the Bay Area. Riders pay an average of $1.63 per boarding, or about $814 a year if you’re commuting regularly. That’s just over 1% of median earnings among people who commute by public transit on systems including BART and Muni.
2. New York-Jersey City-Newark, New York and New Jersey
Nowhere is public transportation more widely used than New York-Jersey City-Newark. The average resident boards transit about 186 times a year, the highest rate in the country and more than double the rate in San Francisco-Oakland. Residents also log more passenger miles per capita than in any other metro. That volume is enough to carry the region to No. 2, even though affordability and safety data aren’t favorable.
Between the subway, city buses and regional commuter rail, riders can get around the five boroughs and reach New Jersey and the surrounding suburbs. Riders pay an average of $1.73 per boarding, or about $864 a year for a regular commuter, which comes out to 1.4% of median earnings (just 33rd least expensive).
Congestion pricing in Midtown and Lower Manhattan, which took effect in January 2025, may be partly why ridership keeps climbing, as more commuters shift away from driving downtown.
New York is also investing in new transit connections to make it easier for residents to access jobs, education and services. Michael Shamma, the New York metro executive at TYLin, a global engineering and infrastructure consulting firm, pointed to the proposed Interborough Express, a light rail line linking Brooklyn and Queens to 17 subway lines and the Long Island Rail Road, without a trip through Manhattan.
3. Washington-Arlington, D.C., Virginia and Maryland
Washington-Arlington ranks No. 3, with high scores in each of the three main broad categories we researched. The average resident boards transit about 59 times a year, third most in the U.S., and 100% of stations are ADA-compliant.
Riders pay an average of $1.28 per boarding, or about $638 a year for regular riders. That’s about 0.9% of median earnings, which is ninth lowest in the U.S.
In the Washington-Arlington area, residents have rail and bus service across the district, Maryland and Virginia through the Metro system, which is reporting an all-time low for crime.
4. Seattle-Tacoma, Washington
Seattle-Tacoma takes the fourth spot on the strength of its usefulness and accessibility score. The average resident boards transit about 47 times a year and accounts for about 275 miles of transit travel, numbers strong enough to put the region in the top five nationally in that category.
Affordability holds it back from ranking higher. The area ranks 19th nationally, with riders paying an average of $1.33 per boarding, or about $663 per year, which amounts to 1.1% of median earnings. Public transit in Seattle-Tacoma is only 19th in safety.
The public transit system isn’t sitting still. Sound Transit opened a light rail extension to Federal Way in December 2025 and a floating bridge across Lake Washington in March 2026, more than doubling the system’s size in just a few years.
5. Salt Lake City, Utah
Salt Lake City ranks fifth mainly because of ridership volume. The average resident boards transit about 34 times annually, 10th most in the U.S., and travels 266 miles, sixth most.
Fares here are the cheapest of any city in the top five, with riders paying about 90 cents per boarding and regular transit commuters spending an estimated $451 a year. But the area’s transit riders also make less, with median earnings of $40,738, so Salt Lake City ranks only 21st in affordability.
Riders here rely on the TRAX light rail system and FrontRunner commuter trains, and both are undergoing changes.
In August 2026, the FrontRunner 2X project, which would add double-tracking, trains and a new station, got another step closer to securing almost $1.3 billion in federal funding. And the Utah Transit Authority is proposing an increase in the base fare from $2.50 to $3 in 2027, which would be the first change since 2013.
The worst cities for public transportation
Oklahoma City ranks dead last for public transit. It posts the lowest usefulness and accessibility score of any metro, with the average resident boarding transit just 3.4 times in 2024. That said, the system has a couple of things going for it. Every station is ADA-compliant, and its average fare of 62 cents per boarding is comparatively low.
A couple of other cities in the bottom 10 tell more surprising stories.
Buffalo has the highest ridership per resident of any city in the bottom 10. But its fares for someone riding five days a week eat up 3.1% of what transit commuters there earn — by far the highest share in the U.S. Memphis has a different issue. Its fares are some of the cheapest nationally, yet the system has the highest rate of injuries and deaths from safety and security events of any city we studied.
Here are the 10 lowest-ranking cities in our analysis:
- Oklahoma City, Oklahoma
- Jacksonville, Florida
- Buffalo, New York
- Indianapolis, Indiana
- Columbus, Ohio
- Memphis, Tennessee, Mississippi and Arkansas
- Virginia Beach-Norfolk, Virginia
- Orlando, Florida
- Cleveland, Ohio
- Louisville/Jefferson County, Kentucky and Indiana
Goyette, the research project manager at the University of South Florida, said weak public transportation systems tend to share a few root causes:
- Agency instability: High staff turnover and outdated training programs can wear a system down.
- Lack of political will: Without consistent local support and funding, even solid transit plans can stall.
- Rider distrust: Route reductions, safety concerns and inconsistent customer service push people away from systems they might otherwise rely on.
Still, a low ranking doesn’t mean transit disappears. These systems still get people where they need to go — just with more friction than riders face in higher-ranked cities.
Comparing public transit across U.S. cities
Population size doesn’t necessarily predict the quality of public transit. Miami and Houston are two of the five biggest urban areas we looked at. Yet, they land at No. 18 and No. 33 overall, respectively, trailing places a fraction of their size, like Salt Lake City and Portland, Oregon (No. 8).
New Orleans posts the highest rate of operational incidents, including collisions, derailments and fires, of any city in our analysis. Ride New Orleans, a nonprofit public transit advocacy group, points to a limited fleet size and unstable funding as ongoing challenges.
See how all 50 cities compare below:
Why move to a city with good public transit?
“Transit can have a huge impact on both the cost of living and someone’s everyday quality of life,” said Shamma, the New York metro executive at TYLin.
Public transit gives you flexibility, and that can add up in several ways when you’re choosing where to live:
- Lower transportation costs: Owning and operating a new vehicle costs an average of $11,577 a year, according to AAA’s 2025 Your Driving Costs analysis. Reliable transit can make it realistic to drive less without giving up the ability to get where you need to go.
- An easier commute: Americans lost an average of 63 hours to traffic delays in 2024, the highest level ever recorded, according to the Texas A&M Transportation Institute’s Urban Mobility Report. Transit won’t fully eliminate delays, but it can give you a break from being behind the wheel.
- Better access to daily needs: “Living near accessible transit allows (people) to travel to critical medical appointments, food shopping, social services,” Goyette said.
- Greater independence: “Adults that cannot or do not want to drive for safety reasons like eyesight or other mobility issues absolutely depend on transit service,” Goyette said.
- Quality-of-life benefits: Living near transit is linked to more walking among older adults, according to a 2023 study in BMC Geriatrics. Residents get a built-in source of physical activity they might not otherwise have.
Before you pursue a fresh start in a specific neighborhood, ask these questions, said Goyette:
- Does service reach the places you’ll need most? A city can rank well overall while still leaving entire neighborhoods with spotty or no coverage.
- How often do routes run? A stop a block away doesn’t help much if the bus only comes once an hour.
- Does the system feel safe, and does it meet accessibility standards? Both affect whether you’ll actually use the system day to day.
Methodology
To determine the cities with the best public transit in the U.S., the ConsumerAffairs Research Team evaluated the 50 most populous U.S. urban areas, as defined by the U.S. Census Bureau, across three weighted categories: usefulness and accessibility, affordability, and operational safety. All metrics use 2024 data, the most recent year available.
Because this is a composite ranking, an urban area's overall position may differ from its ranking in any individual category.
The scores for each category were calculated using the following metrics:
Usefulness and accessibility (50 points)
- Public transit boardings per resident (25 points)
- Public transit passenger miles per resident (20 points)
- Share of transit stations that are compliant with the Americans with Disabilities Act (5 points)
Data comes from the Federal Transit Administration's National Transit Database and the U.S. Census Bureau.
Affordability (25 points)
- Estimated annual transit fares as a share of median earnings for public transit commuters (25 points)
Data comes from the FTA’s National Transit Database and the U.S. Census Bureau.
Operational safety (25 points)
- Collisions, derailments and fires per million vehicle miles traveled in service (15 points)
- People killed or injured in major transit safety and security events per million vehicle miles traveled in service (10 points)
Data comes from the FTA’s National Transit Database.
For each metric, the best-performing urban area received the maximum number of points, while all other urban areas received proportionally lower scores. We then combined the metric scores within each category and added the category scores together to calculate an overall score out of 100 points.
Additional notes:
- Urban areas are Census-defined geographies covering the continuously developed land around a city, which differs from metropolitan statistical areas. We may refer to them as cities or metro areas elsewhere in this story for readability.
- Boardings count each time a rider gets on a vehicle rather than each journey. A commute that involves transferring from a bus to a train counts as two boardings.
- Because ridership in the New York area far exceeds that of any other urban area, we applied a logarithmic transformation to two ridership metrics before scoring so a single outlier would not compress the rest of the field. This changes the spacing between scores on those two metrics while preserving the rank order within them.
- Average fare is total fare revenue divided by total boardings, so the figure reflects passes, transfers and discounts rather than posted fares. The fare calculation covers bus, rail and ferry service; we excluded vanpool, demand-response paratransit and taxi-based services, which operate under separate fare structures. To estimate annual fares, we assumed 500 boardings per year — two boardings a day, five days a week, 50 weeks — applied identically to all 50 urban areas.
Reference policy
We love it when people share our findings! If you do, please link back to our original article to credit our research.
Questions?
For questions about the data or if you'd like to set up an interview, please contact egomes@consumeraffairs.com.
Article sources
ConsumerAffairs writers primarily rely on government data, industry experts and original research from other reputable publications to inform their work. Specific sources for this article include:
- Federal Transit Administration, "The National Transit Database." Accessed Sept. 3, 2026.
- U.S. Census Bureau, "Explore Census Data." Accessed Sept. 3, 2026.
- U.S. Census Bureau, "United States Commuting At A Glance: American Community Survey 1-Year Estimates." Accessed Sept. 3, 2026.
- American Public Transportation Association, "APTA Public Transportation Ridership Update." Accessed Sept. 3, 2026.
- American Public Transportation Association, "Transit Savings Grow As Auto Costs and Gas Prices Increase." Accessed Sept. 3, 2026.
- MTA, “Subway and bus ridership for 2025.” Accessed Sept. 3, 2026.
- WMATA, “Metro announces service updates to select Metro Bus routes beginning September 13.” Accessed Sept. 3, 2026.
- Sound Transit, "Link light rail opens across Lake Washington." Accessed Sept. 3, 2026.
- Sound Transit, "Light rail to Lynnwood opens." Accessed Sept. 3, 2026.
- UDOT, "FrontRunner 2X advances to final phase of process for nearly $1.3 billion federal grant." Accessed Sept. 3, 2026.
- Utah Transit Authority, “Utah Transit Authority seeks public input on proposed fares and service changes in 2027.” Accessed Sept. 3, 2026.
- Ride New Orleans, "Ride New Orleans State of Transit Reports." Accessed Sept. 3, 2026.
- AAA, "AAA: New Vehicle Costs Drop to $11,577." Accessed Sept. 3, 2026.
- Texas A&M Transportation Institute, "Traffic Hits Record High as Commuters Rewrite the Rush Hour." Accessed Sept. 3, 2026.
- National Center for Biotechnology Information, "Public transit stop density is associated with walking for exercise among a national sample of older adults." Accessed Sept. 3, 2026.
Figures