Solar Energy Facts & Statistics (2026 Data)
+3 more

Solar power is a clean, cheap and long-term energy source. The U.S. solar energy sector is experiencing rapid expansion, with a 3.5% increase in solar energy jobs between 2021 and 2022. The majority, comprising about two-thirds of U.S. solar jobs, are in installation and project management. Other sectors contributing to solar energy employment include manufacturing (12.7%), sales and distribution (11.6%), and operations and maintenance (6.3%). Projections indicate an anticipated annual growth rate of 15% in the solar energy industry over the next five years. Solar generation rose 23% in 2021, and the industry is expected to continue to grow over the next decade.
Women hold 40% of full-time positions in the global solar workforce.
Jump to insightNearly 75% of homeowners state upfront cost is the main deterrent to not installing solar panels.
Jump to insightThe average cost to install solar panels equates to $2.86 per watt, or $28,600 for a 10kW system.
Jump to insightChina is the world's largest solar producer.
Jump to insightGeneral solar energy statistics
Solar energy capacity continues to grow across the U.S., with over 50% of states now having 1 gigawatt (GW) or more of solar installed.
Percentage of renewable energy
The U.S. solar industry is booming, with solar contributing a significant share of new electricity capacity additions in 2023, expected robust growth in 2024, rising residential adoption, and renewable sources collectively generating over 30% of global electricity, while coal power continues its decline.
- Solar contributed 53% of all new electricity-generating capacity added to the U.S. grid in 2023.
- The U.S. solar industry expects to add 36 GW of new electricity-generating capacity in 2024, a growth of nearly 38% from 2023.
- Residential solar use is expected to grow at an average of 6% annually over the next five years.
- All renewable energy sources combined generated 30.2% of the world’s electricity in 2023.
- Solar power accounted for 4.75% of electricity generated in the U.S. in 2022, with California contributing the largest share at more than 27%.
- In the U.S., coal-powered energy production has been declining, from 958.7 billion kilowatt-hours (kWh) in 2019 down to 670.7 billion kWh in 2023, a 30% reduction.
Solar energy efficiency
The efficiency of a solar panel (stated as a percentage) is determined by the amount of sunlight reflected on the panel’s surface that’s then converted into electricity. Currently, the efficiency of commercial solar panels is typically between 19.7% and 21.6%, with some high-efficiency solar panels extending to nearly 23%. Today, researchers are designing solar cells that are more than 47% efficient.
Solar power prices around the world can be as low as $0.01 to $0.02 per kWh, compared with U.S. retail electricity, which averaged about $0.17 per kWh for residential consumers in the beginning of 2024.
Solar industry jobs
Women hold 40% of full-time positions in the global solar workforce, far higher than the 32% share of jobs held by women across the renewable energy sector as a whole.
- As of 2022, 263,882 solar workers were employed in the U.S. solar industry across all 50 states, Washington, D.C., and Puerto Rico. This represents a 3.5% increase (8,844 new jobs) since 2021.
- Installation and project management jobs make up 65% of all solar energy sector employment. Other popular jobs in solar energy include manufacturing (12.7%), sales and distribution (11.6%) and operations and maintenance (6.3%).
- Unionized workers, or those covered by project labor agreements ensuring union-scale pay, make up 10.5% of the overall solar industry workforce.
Solar capacity and production
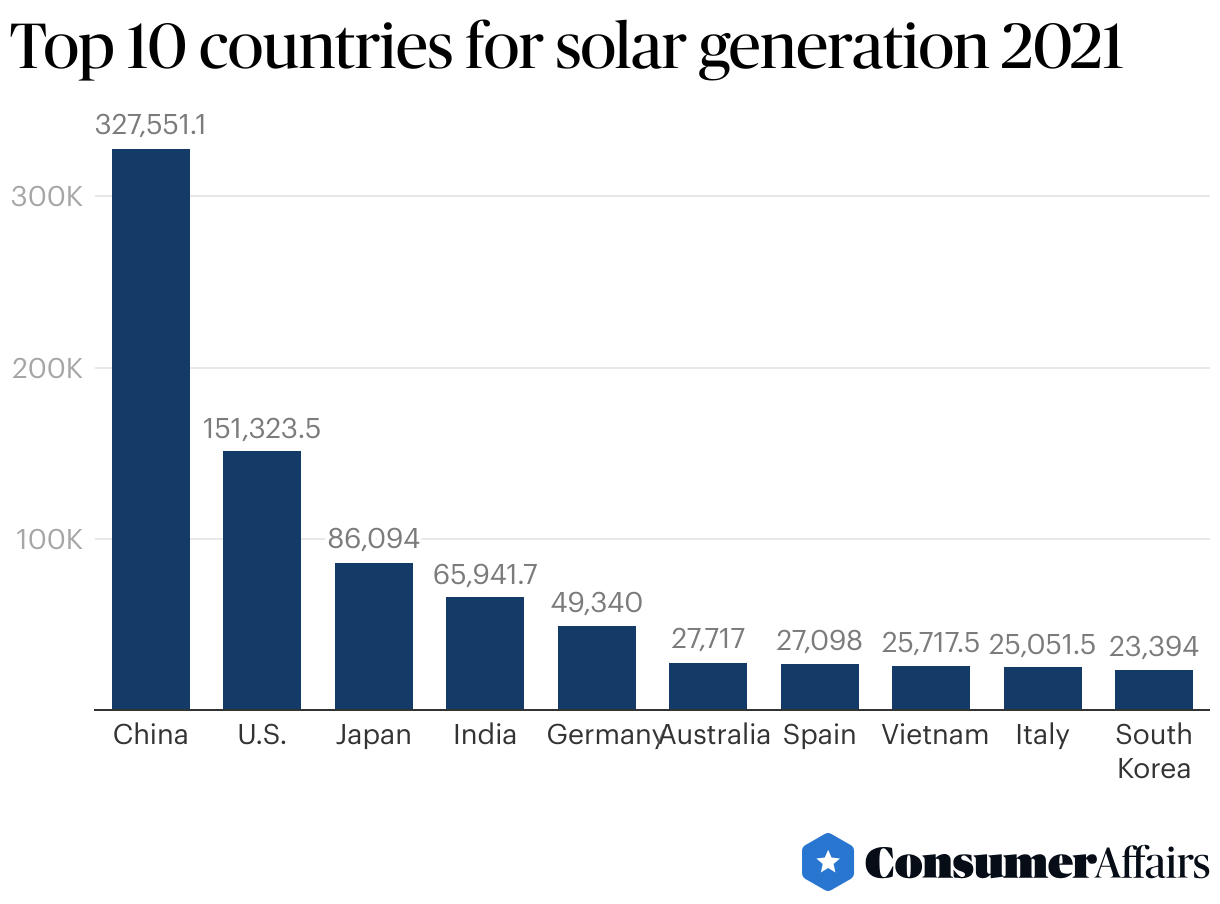
According to the most recent data, the top 10 countries that produced the most solar power (in gigawatt-hours (GWh)) globally in 2021 are visualized below.
Capacity
Solar contributed 53.5% of all new electricity-generating capacity added to the U.S. grid in 2023.
- Solar energy capacity is the maximum amount of energy that a combination of solar installations can produce at any given time. The current global solar energy capacity in 2022 was 1,177 GW.
- Up to 173,000 terawatts of solar energy are hitting the Earth at any given moment.
As of 2023, China had the world's largest cumulative solar energy capacity at 609.9 GW. The country increased its solar capacity by nearly 217 GW in 2023 alone, followed by the U.S., which increased capacity by 24.8 GW and Germany (14.3 GW).
Newly installed solar power capacity by country, 2023
The table below shows total capacity installed per country in 2023.
| Solar capacity added (in GW) | |
|---|---|
| China | 216.9 |
| U.S. | 24.8 |
| Germany | 14.3 |
| Brazil | 11.9 |
| India | 9.7 |
| Spain | 5.4 |
| Italy | 5.2 |
| Japan | 4.0 |
| Australia | 3.7 |
| South Korea | 3.0 |
Cumulative solar power capacity by country, 2023
The table below shows total cumulative solar capacity by country in 2023.
| Solar capacity (in GW) | |
|---|---|
| China | 609.9 |
| U.S. | 139.2 |
| Japan | 87.1 |
| Germany | 81.7 |
| India | 73.1 |
| Brazil | 37.4 |
| Australia | 33.7 |
| Spain | 31.0 |
| Italy | 29.8 |
| South Korea | 27.0 |
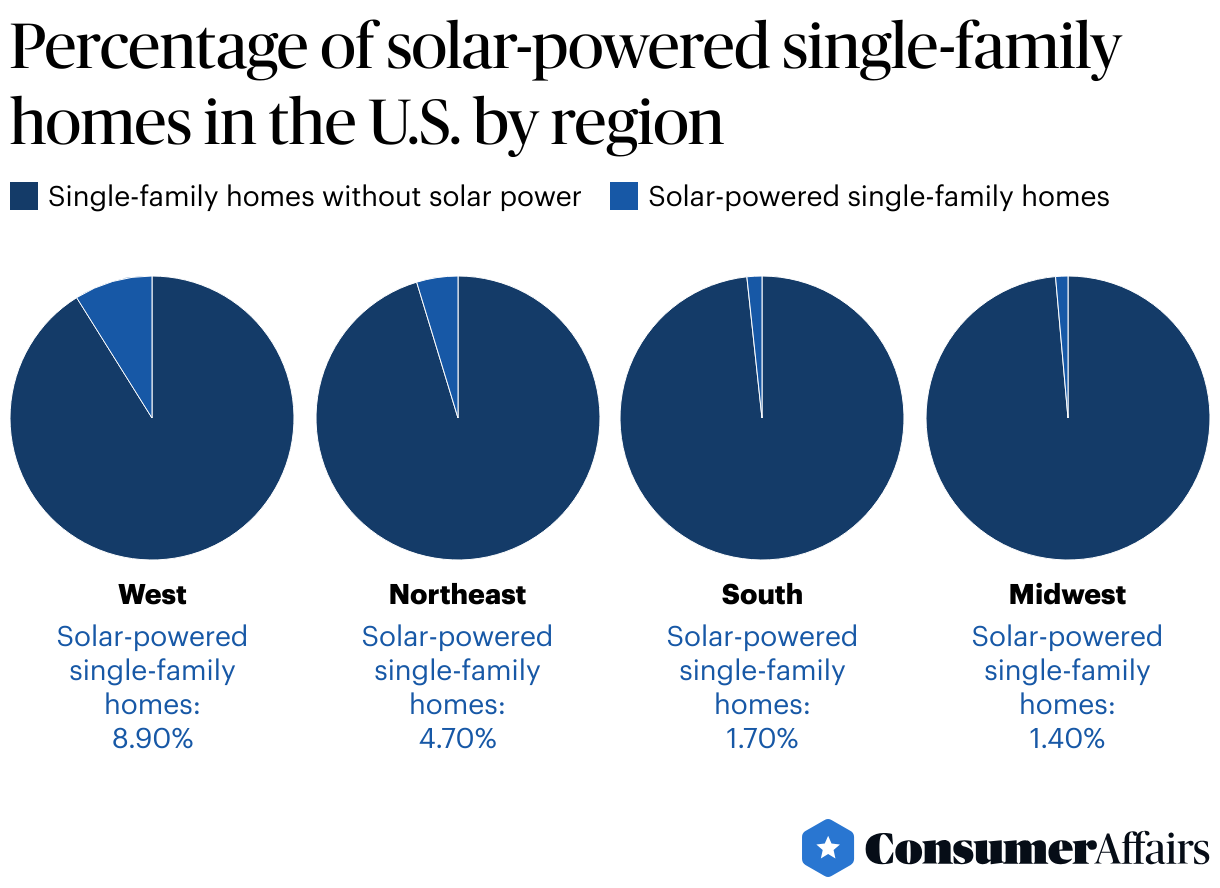
Characteristics of solar-powered homes in the U.S.
In 2022, 4.4% of single-family homes across the U.S. generated electricity from solar panels. Regionally, the percentage varied significantly.
U.S. homes installed 6.8 GW of solar energy capacity in 2023, a 12% increase from 2022. Among homeowners without solar power, 66.5% express interest in installing in the future. Notable statistics regarding this cohort include the following:
- Nearly 75% cite upfront costs as the primary reason for not moving forward with installation.
- About 44% feel the price of installing solar panels is too expensive and outweighs solar’s benefits.
- Over 43% decided against installation because their roof would need to be replaced, increasing the cost of installation.
Solar panels are more likely to be installed on newer homes with affluent homeowners.
- Small-scale solar panel systems are installed on 4.6% of homes built in 1980 or later, compared with 3.2% of homes built before 1980.
- Only 1.1% of homes with a household income of less than $20,000 use solar, compared with 5.7% of homes with a household income of more than $150,000.
Cost of solar panel installation
Installing solar panels on your home is a long-term investment. It takes an average of 8.7 years to see the return on your investment after solar panel installation.
That said, the cost of installing residential solar panels has dropped by approximately 70% over the past 10 years. The average cost of solar panel installation in the U.S. is $2.86 per watt, which works out to $28,600 for a 10 kW system.
Factors that impact the cost of a residential solar panel system include:
- System size
- Residence location
- Panel quality
- Panel type
- Roof type
- Labor source and installation timetable
- Permitting and interconnection
Solar energy tax breaks
The investment tax credit (ITC) is a federal solar tax credit. The ITC allows U.S. homeowners to deduct 30% of the cost of solar panel installation from their federal income taxes with no cap on its value.
The average cost of solar panel system installation without the ITC is $28,600. When factoring in the ITC’s 30% income tax deduction, that average cost drops to $20,020.
Other state and local incentives may also be available depending on where you live, such as additional tax credits, performance-based incentives and grants.
What does the future look like for solar?
Projections indicate that the trend toward solar energy won’t slow anytime soon.
- It’s expected that over 36 GW of solar energy capacity will come online this year in the U.S.
- Annual growth in the solar energy industry is anticipated to average 15% over the next five years.
- Residential solar use is expected to grow at an average of 6% annually over the next five years. Commercial solar use is projected to increase by 8% annually.
- Long-term tax incentives and manufacturing provisions included in the Inflation Reduction Act drive the expectation for solar energy growth.
Solar vs. fossil fuels
A comparison of solar energy versus energy from fossil fuels reveals that, while solar is far more sustainable, its use is still eclipsed by fossil fuels.
- Fossil fuels are the source of more than 80% of the world’s energy.
- Solar energy is significantly more efficient than energy derived from fossil fuels.
- Solar panels are constructed primarily with recyclable materials. About 75% of a solar panel’s weight is made up of glass.
CO2 emissions
Solar energy generates significantly less carbon dioxide emissions compared to fossil fuels like coal, contributing to the forecasted decline in energy-related CO2 emissions due to the increasing adoption of renewable sources.
- The use of solar energy emits a significantly lower amount of carbon dioxide (CO2) than the use of energy from fossil fuels.
- Burning coal emits at least 17 times the CO2 emitted by solar energy generation.
- A report by the U.S. Energy Information Administration (EIA) forecast that CO2 emissions from the energy sector would decrease by 3% between 2022 and 2023. Most of the decline was attributed to a decreased reliance on coal as an energy source thanks to increases in renewable energy production, such as solar.
FAQ
How efficient are solar panels?
The efficiency of solar panels is generally between 19.7% and 21.6%, with some high-efficiency solar panels extending to nearly 23%. Solar power prices around the world can be as low as $0.01 to $0.02/kWh, compared with U.S. retail electricity prices, which averaged $0.17/kWh for residential consumers in 2023.
Is solar energy a good career?
Solar energy is a fast-growing industry, and the number of solar energy jobs in the U.S. grew by 3.5% from 2021 to 2022. The majority (65%) of solar energy jobs are in installation and project management, but other areas of solar energy employment include manufacturing (12.7%), sales and distribution (11.6%) and operations and maintenance (6.3%). The solar energy industry is expected to grow an average of 15% annually over the next five years.
What percentage of U.S. energy comes from solar?
In 2022, solar power accounted for 4.75% of the energy generated in the U.S. Solar power contributed nearly 54% of all new electricity-generating capacity added to the U.S. grid in 2023.
Article sources
ConsumerAffairs writers primarily rely on government data, industry experts, and original research from other reputable publications to inform their work. Specific sources for this article include:
- Ember, “Global Electricity Review 2022.” Accessed Oct. 1, 2023.
- Energy Information Administration, “Frequently Asked Questions (FAQs): What is U.S. electricity generation by energy source?” Accessed Oct. 1, 2023.
- International Renewable Energy Agency, “Renewable Energy and Jobs: Annual Review 2023.” Accessed Oct. 1, 2023.
- Solar Energy Industries Association, “Solar Industry Research Data.” Accessed Oct. 1, 2023.
- Solar Energy Industries Association, “Solar Market Insight Report 2023 Q3.” Accessed Oct. 1, 2023.
- Center for Sustainable Systems, University of Michigan, “Photovoltaic Energy Factsheet.” Accessed Oct. 1, 2023.
- Interstate Renewable Energy Council, “Solar Jobs Census.” Accessed Oct. 1, 2023.
- TheRoundup, “35 Latest Solar Power Statistics, Charts & Data.” Accessed Oct. 1, 2023.
- International Energy Agency, “Snapshot of Global PV Markets 2022.” Accessed Oct. 1, 2023.
- World Population Review, “Solar Power by Country 2023.” Accessed Oct. 1, 2023.
- Environmental Protection Agency, “Solar Panel Recycling.” Accessed Oct. 1, 2023.
- Energy Information Administration, “Homes and buildings in the West and Northeast have the largest share of small-scale solar.” Accessed Oct. 11, 2023.
- Solar Energy Industries Association, “Solar Market Insight Report 2022 Q4.” Accessed Oct. 11, 2023.
- EnergySage, “How much do solar panels cost in 2023?” Accessed Oct. 11, 2023.
- Environmental and Energy Study Institute, “Fossil Fuels.” Accessed Oct. 18, 2023.
- EnergySage, “How much do solar panels cost in 2023?” Accessed Oct. 11, 2023.
- Environmental and Energy Study Institute, “Fossil Fuels.” Accessed Oct. 18, 2023.
- EnergySage, “How much do solar panels cost in 2023?” Accessed Oct. 11, 2023.
- Environmental and Energy Study Institute, “Fossil Fuels.” Accessed Oct. 18, 2023.
- International Energy Agency, "Executive Summary". Accessed Oct. 20, 2023.
- U.S. Energy Information Administration, "U.S. electric power sector capacity and generation." Accessed Feb. 28, 2024.
- Our World in Data, "Electricity generation from solar power." Accessed Feb. 28, 2024.
- Bureau of Labor Statistics, "Average energy prices for the United States, regions, census divisions, and selected metropolitan areas." Accessed Feb. 29, 2024.
- Solar Energy Industries Association, “Solar Industry Research Data.” Accessed Feb. 29, 2024.
- Department of Energy, "DOE Report Finds Clean Energy Jobs Grew in Every State In 2022." Accessed Feb. 29, 2024.
- U.S. Energy Information Administration, "Solar and wind to lead growth of U.S. power generation for the next two years." Accessed Feb. 29, 2024.
- Statista, "Share of solar electricity production in the U.S. 2010-2022." Accessed Feb. 29, 2024.
- International Renewable Energy Agency, “Country Rankings.” Accessed April 8, 2024.
- Interstate Renewable Energy Council, “13th Annual National Solar Jobs Census 2022 Executive Summary.” Accessed April 4, 2024.
- U.S. Energy Information Administration, “Short-Term Energy Outlook Data Browser.” Accessed April 4, 2024.
- EnergySage, “How efficient are solar panels? Top brands compared in 2024.” Accessed April 4, 2024.
- National Renewable Energy Laboratory, “Interactive Best Research-Cell Efficiency Chart.” Accessed April 4, 2024.
- Inside Climate News, “The Solar Industry Gained Jobs Last Year. But Are Those Good Jobs, and Could They Be Better?” Accessed April 4, 2024.
- International Renewable Energy Agency, “Renewable Energy Country Rankings.” Accessed April 4, 2024.
- Solar Energy Industries Association, “U.S. Solar Market Insight.” Accessed April 4, 2024.
- U.S. Energy Information Administration, “Lower CO2 emissions are partially due to shifts in power generation sources.” Accessed April 4, 2024.
Figures