States with the Worst Teen Drivers 2026
+1 more

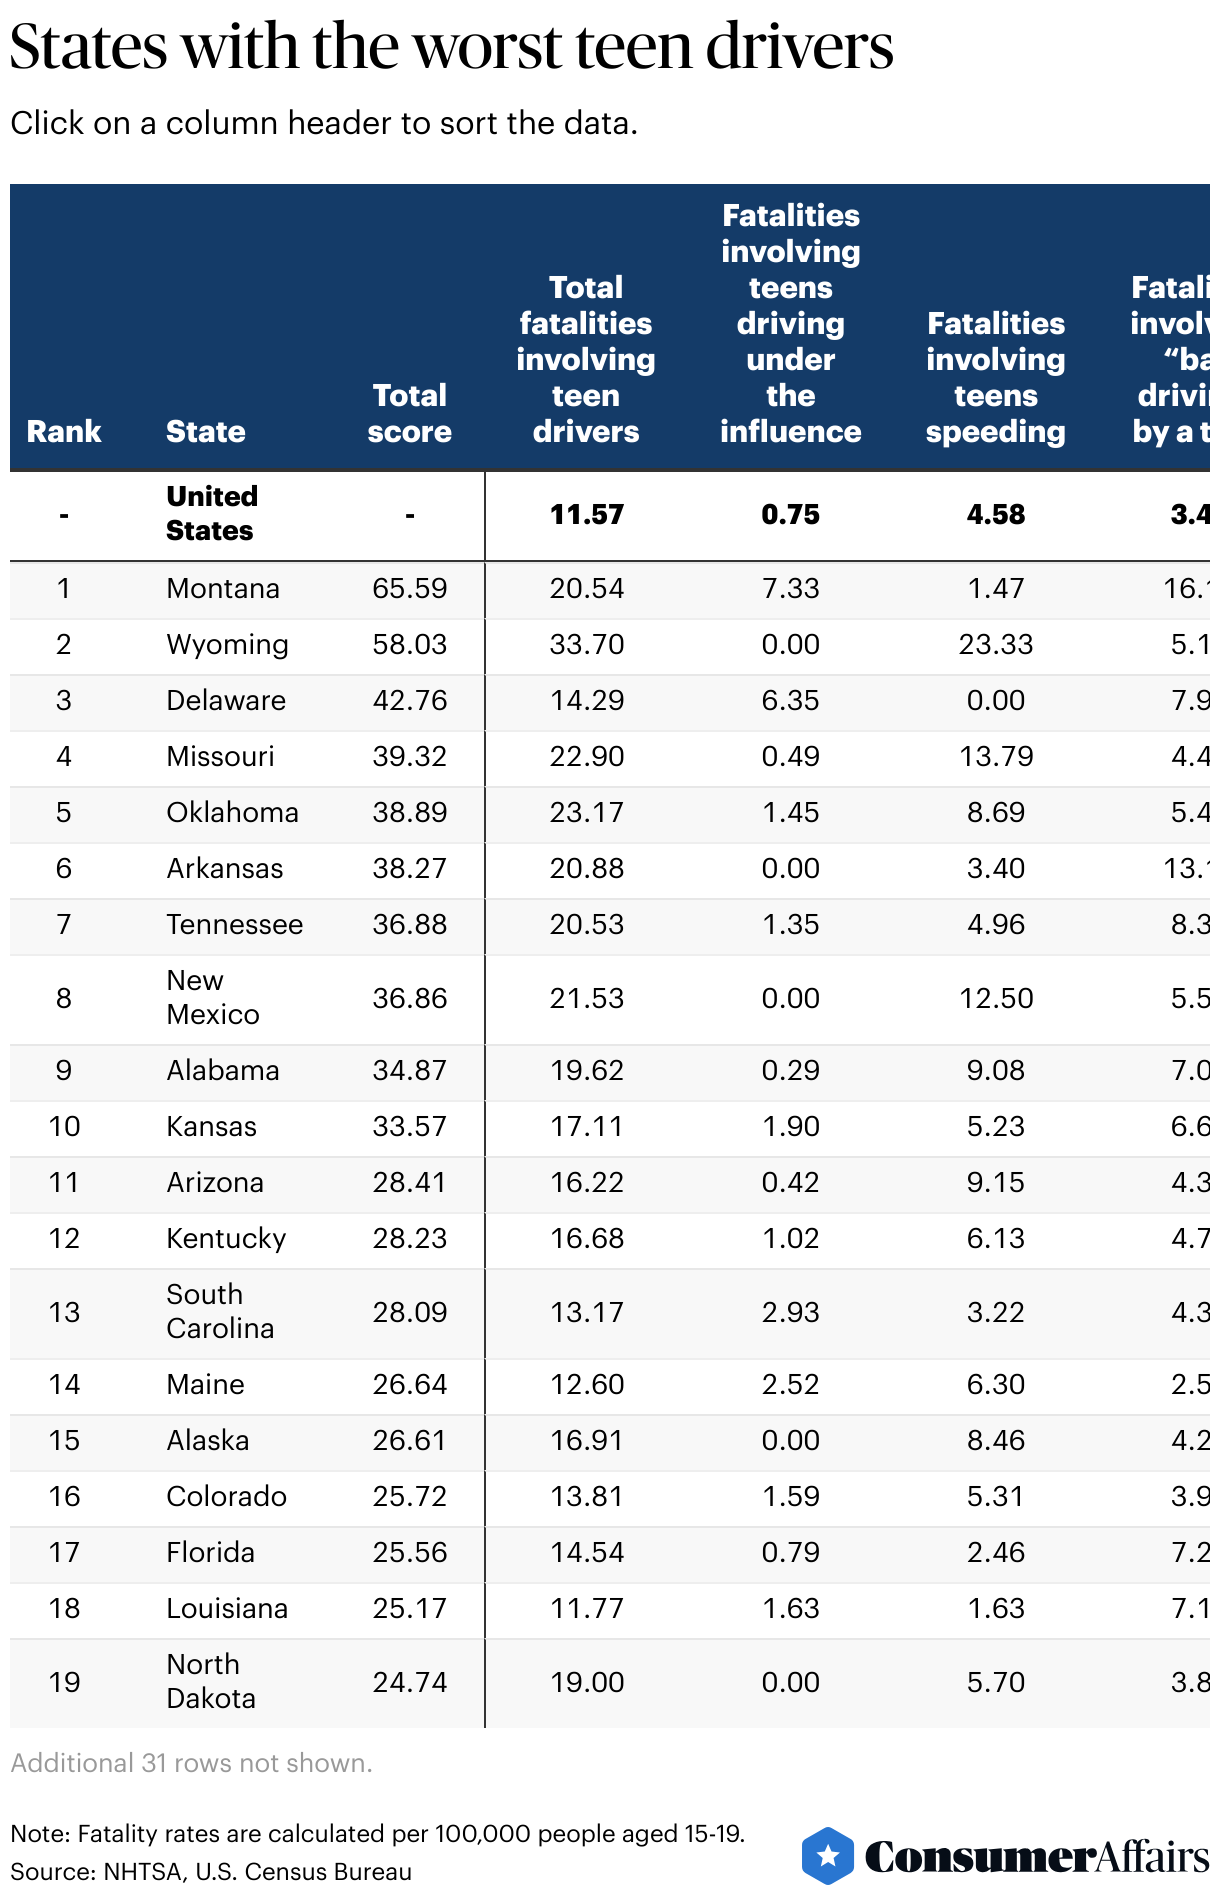
Traffic fatalities have been gradually declining nationwide, but teen drivers continue to face outsize risks of fatal crashes. According to the Governors Highway Safety Association (GHSA), young drivers are nearly four times more likely to be involved in fatal traffic crashes than older drivers. In 2022, there were more than 2,500 fatalities involving teen drivers in the U.S. That’s a sobering average of 11.57 fatalities for every 100,000 American teenagers.
Whether you’re a new driver, the parent or loved one of a newly licensed teen, or simply another driver sharing the road with young motorists, it’s critical to understand the safety risks associated with teen drivers. Comprehensive car insurance is one measure of protection against the dangers of the road, but vigilant, distraction-free driving goes a long way in making our streets safer for everyone.
To determine the states with the worst teenage drivers, the ConsumerAffairs Research Team analyzed fatal crash data involving drivers aged 15 to 19, considering factors such as bad driving, speeding and driving under the influence.
Montana has the worst teen drivers overall in the U.S. It has the highest rates of fatalities involving teens driving under the influence and fatalities involving teens engaging in bad driving behaviors.
Jump to insightEight out of the 10 worst states for teen drivers are in the West and South.
Jump to insightWyoming has the highest rate of total traffic fatalities involving a teen driver, at 33.7 per 100,000 teens.
Jump to insightNew Jersey has the lowest rate of fatalities involving teen drivers in the nation and had zero fatalities involving teens driving under the influence in 2022.
Jump to insightAre teen drivers getting worse?
The data doesn’t necessarily suggest that teen drivers are getting significantly worse: Fatality rates have remained relatively steady over the past decade, with an average fatality rate of 10.87 per 100,000 teens from 2012 to 2022.
While the rates have not fluctuated dramatically in this span — the difference between the highest and lowest points is about 2.5 fatalities per 100,000 — these numbers represent real lives lost, making even small increases or decreases meaningful. And with continual advancements in safety technology, it's concerning that the rate of fatalities involving teen drivers hasn’t fallen more steadily over the past decade.
We spoke with Rebecca Weast, a senior research scientist at the Insurance Institute for Highway Safety (IIHS), to help contextualize how the rates have changed in recent years. “While teen fatal crashes did rise from 2012 to 2022, this trend was not linear and was not limited to teen drivers. Fatalities dropped from 2017 to 2019 before rising during COVID, and this trend is also visible across adult drivers,” she said, adding that the pandemic created an unexpected combination of lower traffic volume but more crash deaths.

Which states have the worst teen drivers?
The five states with the worst teen drivers are spread across the West, Midwest and South and vary demographically. However, it appears that unsafe driving behaviors in the worst-ranked states aren’t limited to just teenagers. The states with the highest scores tend to have ranked poorly in at least one of our other rankings related to driver safety, including the states with the worst drivers overall, the worst rates of drunk driving, the highest rates of fatal car crashes and the prevalence of road rage.

1. Montana
65.59 out of 100 points
Montana’s rank as the worst state for teen drivers is consistent with its top ranking for states with the worst drivers overall. The state has the highest fatality rates in the country involving teens engaging in “bad driving” behaviors, including careless or aggressive driving, and it ranks deadliest for teens driving under the influence.
It’s worth noting Montana also has some of the most lenient laws around distracted driving: There are no state laws banning cellphone use while driving, even for new drivers. In fact, at the time of publication, Montana is the only state in the nation that hasn’t yet banned texting while driving.
However, some efforts are underway in Big Sky Country to make roads safer for young drivers. A bill to revise traffic laws related to distracted driving passed in the Montana Senate in February 2025 and is awaiting further legislative action. Local organizations like Safe Kids Yellowstone County are promoting safe driving initiatives among high school students, and in 2024, the Montana Department of Transportation used grant funds from GHSA and Ford to help address the shortage of driver education instructors in Native American communities and provide hands-on workshops to tribal youth.
Note the following key metrics:
- Total fatalities involving teen drivers: 20.54 per 100,000 teens
- Fatalities involving teens driving under the influence: 7.33 per 100,000 teens (worst in the U.S.)
- Fatalities involving teens speeding: 1.47 per 100,000 teens
- Fatalities involving teens engaging in “bad driving” behaviors: 16.14 per 100,000 teens (worst in the U.S.)
2. Wyoming
58.03 out of 100 points
Wyoming ranks as the second-worst state overall for teen drivers, and it leads the nation in total fatalities involving teen drivers, at a rate of almost 34 deaths per 100,000 teens. That’s nearly triple the national average. Wyoming also ranks as the worst in the country for fatalities involving teens speeding, with more than 23 fatalities per 100,000 teens, which is more than five times the national average rate.
However, the crash data contains some surprises: Wyoming is also one of more than a dozen states with zero fatalities involving teens driving under the influence in 2022, despite ranking third worst in the country for drunken driving overall.
While no one factor can explain all of the data, Wyoming’s graduated driver licensing (GDL) laws may help begin to unpack some aspects behind these tragic statistics. While Wyomingites have to wait until age 15 to get their learner’s permit and age 16 to earn an intermediate license (which allows unsupervised driving), the Cowboy State mandates a learning period of just 10 days. This means that a teen driver may have only had a few weeks of supervised driving before hitting the road independently. (For comparison, the vast majority of U.S. states require at least six to 12 months in the “learner” stage to gain skills, experience and confidence behind the wheel.)
Noteworthy data points include:
- Total fatalities involving teen drivers: 33.7 per 100,000 teens (worst in the U.S.)
- Fatalities involving teens driving under the influence: 0 per 100,000 teens (best in the U.S.)
- Fatalities involving teens speeding: 23.33 per 100,000 teens (worst in the U.S.)
- Fatalities involving teens engaging in “bad driving” behaviors: 5.18 per 100,000 teens
3. Delaware
42.76 out of 100 points
Delaware presents a complex picture of teen drivers’ safety, with key metrics ranking near the very top and very bottom of the spectrum. The First State earned its rank as third worst overall because of high rates of fatalities involving teens driving under the influence (second worst in the country) and fatalities involving teens engaging in “bad driving” behaviors. Delaware is also above the national average for total rates of fatalities involving teen drivers. Previously, we found the state ranks eighth worst for road rage.
However, there are a number of bright spots. Delaware ranks 50th for fatalities involving teen speeding, with zero fatalities in 2022. Delaware also has strong distracted driving laws: Teenage drivers are banned from all cellphone use while driving, and drivers of all ages must abide by the texting-while-driving ban and “hands-free” laws for cellphone use.
Other notable stats:
- Total fatalities involving teen drivers: 14.29 per 100,000 teens
- Fatalities involving teens driving under the influence: 6.35 per 100,000 teens (second worst in the U.S.)
- Fatalities involving teens speeding: 0 per 100,000 teens (best in the U.S.)
- Fatalities involving teens engaging in “bad driving” behaviors: 7.94 per 100,000 teens (fourth worst in the U.S.)
4. Missouri
39.32 out of 100 points
Ranking fourth worst for teen drivers overall, Missouri has the third-highest rate of fatalities involving teen drivers (roughly double the national average) and the second-highest rate of fatalities involving teens speeding (triple the nationwide rate). Rough terrain may play a contributing role: ConsumerAffairs recently found that Missouri has the sixth-worst roads in the country, with nearly 40% of its urban roads and more than 21% of rural roads in poor condition.
In the face of these concerning stats, the Show Me state is taking some steps to improve the safety of its roads, especially for young drivers. Missouri’s Strategic Highway Safety Plan for 2021 to 2025 sets a goal of zero fatalities caused by traffic crashes by 2030. “While Missouri cannot simply legislate its way to zero fatalities,” the report acknowledges, “there are several opportunities to strengthen the traffic safety culture, including … stronger requirements for a graduated driver license.”
One opportunity for improvement may be tighter restrictions on nighttime driving for teens: Missouri’s current GDL laws allow drivers with intermediate-stage licenses to be out driving alone until 1 a.m. (For comparison, some states have a “curfew” of 10 p.m. or earlier to mitigate the higher fatality risks of driving at night.) IIHS’s graduated licensing calculator estimates that Missouri moving the restriction from 1 a.m. to 10 p.m. would reduce fatal crashes by 7%.
Consider these noteworthy figures:
- Total fatalities involving teen drivers: 22.90 per 100,000 teens (third worst in the U.S.)
- Fatalities involving teens driving under the influence: 0.49 per 100,000 teens
- Fatalities involving teens speeding: 13.79 per 100,000 teens (second worst in the U.S.)
- Fatalities involving teens engaging in “bad driving” behaviors: 4.43 per 100,000 teens
5. Oklahoma
38.89 out of 100 points
The Sooner State ranks fifth worst for teen drivers, with poor scores across all four metrics we analyzed. In some categories, driver safety in Oklahoma appears to be significantly worse among teen drivers than more mature drivers. Among motorists of all ages, Oklahoma ranks 30th for fatal crashes due to "bad driving" behaviors and 32nd for drunk driving. Compare that with how the state ranks for fatalities involving teen drivers in similar situations: 13th for fatalities involving teen “bad driving” and 11th for fatal crashes involving teens driving under the influence.
Interestingly, Oklahoma does not have a cellphone ban for novice drivers like some other states do, but drivers of all ages must adhere to the ban on texting while driving.
Though ranking poorly in teen driver safety, Oklahoma is the first state in the nation to require that teen drivers complete a training course for work zone and first responder safety before applying for their intermediate driver’s license. Since the law took effect in late 2023, more than 63,500 Oklahoman teens have completed the course, according to the Oklahoma Department of Transportation.
Note these key metrics:
- Total fatalities involving teen drivers: 23.17 per 100,000 teens (second worst in the U.S.)
- Fatalities involving teens driving under the influence: 1.45 per 100,000 teens
- Fatalities involving teens speeding: 8.69 per 100,000 teens (sixth worst in the U.S.)
- Fatalities involving teens engaging in “bad driving” behaviors: 5.43 per 100,000 teens
Teen driving crash rates by state
Like traffic laws, road conditions and graduated licensing requirements, the rate of fatalities involving teen drivers varies widely from state to state. According to the latest available data, New Jersey had just 3.73 fatalities per 100,00 teens — approximately one-third of the nationwide average — while Wyoming’s rate of fatalities involving teen drivers is nine times that, or nearly triple the national average, at 33.7 per 100,000 teens.
How safe are teenage drivers in your state? For a fuller picture of teen driving safety in the U.S., see the data below.
How to make sure your teen stays safe on the road
It can be alarming to learn about these statistics, especially if there’s a teen driver in your life (or you’re a young driver yourself). However, there are steps drivers and their parents can take to practice safe driving habits and help reduce the risk of fatal crashes. We consulted with two leading specialists at AAA for expert advice.
Limit peer passengers
You or your teen may not think of their friends as distractions, but that’s just what they are when a young motorist is behind the wheel. Studies show that having multiple passengers younger than 21 (and no older passengers in the car) substantially increases the risk of death for teen drivers.
“Just by having one peer passenger, you’re going to increase your risk of a fatal crash by over 40%, and it gets worse as you add more (peer passengers),” said William Van Tassel, manager of driver training programs at AAA. How much worse? According to research by the AAA Foundation for Traffic Safety, a teen driver's risk of death per mile quadruples when carrying three or more passengers younger than 21 (and no older passengers). “That’s why (some) states limit the number of peer passengers that teens can have through their graduated driver licensing laws,” Van Tassel explained.
Whether your state has these restrictions or not, heed the data: Encourage solo driving, or limit your teen driver to taxiing just one friend at a time.
Take extra caution at night
Teens should be aware of the heightened risk of deadly crashes when driving at night. According to IIHS, the fatal crash rate per mile driven for 16- to 19-year-olds is more than twice as high for teen girls as it is for female drivers ages 30 to 59, and the rate for teen boys is nearly three times as high as it is for male adults ages 30 to 59.
And, parents, don’t skimp on practicing driving with your teen at night. Most states require 10 hours of night driving before a teen can earn their intermediate driver’s license, but even if your state mandates fewer night driving hours (or none at all), consider logging at least 10 hours of supervised night driving to help them get comfortable with the unique circumstances of driving in the dark.
Gradually increase responsibility
According to the Centers for Disease Control and Prevention, the crash rate per mile driven is about 50% higher for 16-year-old drivers than it is for 18- to 19-year-old drivers. While it’s an exciting American tradition to get a set of wheels upon turning 16, consider waiting until your teen is truly comfortable and confident in the driver’s seat before they take their driver’s test and have a car they call their own.
“We recommend to parents, don’t just go out and buy your brand-new teen driver a vehicle exclusively for them. Start with a shared vehicle — let them prove themselves first — and then perhaps consider obtaining a vehicle for them,” said Van Tassel.
Choose a safe vehicle
When it comes to choosing that first car for your teen driver, Van Tassel and David Bennett, manager of repair systems at AAA, recommend choosing a vehicle that has the latest safety technologies, but not more size, horsepower or bells and whistles than a new driver can comfortably handle. “Even electric vehicles can typically accelerate very quickly, probably far more quickly than they need to,” Van Tassel said, instead recommending a low-powered EV or just a midsize passenger sedan.
Bennett underscored that the latest safety technologies (such as automatic emergency braking) are no replacement for careful driving habits. “They’re all tools, and if you rely on them too much, those tools could fail,” he said.
Explore coverage options
While car insurance or an extended auto warranty won’t change the safety risks your teen faces on the road, comprehensive policies can grant you some peace of mind that costly vehicle repairs will be covered if an accident occurs or a part fails, making it less safe to drive.
Bennett says that choosing a car warranty for a teen driver isn’t really different from choosing one for any other driver. “The important thing is understanding what you’re buying,” Bennett said. The best policy type? An exclusionary policy, where everything is covered except what’s written as excluded. Before purchasing a warranty, make sure you note all the details of the policy, including what the deductible is and whether you can take the car to any repair shop.
Finally, get your teen involved in the decision — even if they don’t pay for their own car coverage (yet), it’s an opportunity to learn about the cost of a policy and to further discuss the importance of safe driving habits.
The bottom line
Ultimately, parents or guardians have a major role to play in setting up their teen for safe, responsible driving. “Parents and guardians are most often the gatekeepers to vehicle access and practice for teens who are subject to (graduated driver licensing laws),” said Weast of IIHS. “Evidence suggests that the quality of the practice driving the teen does can outweigh sheer quantity of practice, so my advice to families is to ensure that the teen gets a chance to drive on all different kinds of roads, in different levels of traffic and varied weather and light conditions.”
Weast also suggests that parents and guardians should continue to check in and drive with the teen, even after they’re licensed and driving independently. “Teens don't become flawless expert drivers just because they passed their road test,” she said.
Methodology
The ConsumerAffairs Research Team identified the states with the worst teen drivers by analyzing 2022 crash data from the National Highway Traffic Safety Administration (NHTSA) Fatality Analysis Reporting System (FARS), the most recent data available.
We evaluated four crash factors, each with a maximum value of 25 points. For each factor, the state that performed the worst was given the highest possible score, with others getting relative scores. We added the category scores together to get an overall score, which is out of 100 points.
Each factor was calculated per 100,000 people aged 15 to 19:
- Total fatalities involving drivers aged 15 to 19
- Fatalities involving drivers aged 15 to 19 under the influence (including alcohol, drugs or medication)
- Fatalities involving speeding by drivers aged 15 to 19
- Fatalities involving “bad driving” by drivers aged 15 to 19
“Bad driving” includes behaviors such as:
- Aggressive driving
- Careless driving
- Driving the wrong way on a one-way traffic way
- Failure to yield the right of way
- Following improperly
- Improper or erratic lane-changing
- Making an improper turn
- Operating the vehicle in an erratic, reckless or negligent manner
- Operator inexperience
- Passing where prohibited
Note: The “total fatalities involving teen drivers” metric includes factors mentioned in our data (such as speeding, impaired driving and other poor driving behavior), but it also covers additional factors we didn’t include in our methodology. Therefore, the total fatality number for each state is higher than the sum total of the three specific metrics highlighted.
For questions about the data or if you'd like to set up an interview, please contact acurls@consumeraffairs.com.
Reference policy
We love it when people share our findings! If you do, please link back to our original article to credit our research.
Article sources
ConsumerAffairs writers primarily rely on government data, industry experts and original research from other reputable publications to inform their work. Specific sources for this article include:
- National Highway Traffic Safety Administration, “Fatality Analysis Reporting System (FARS).” Accessed March 18, 2025.
- U.S. Census Bureau, “S0101 Age and Sex.” Accessed March 18, 2025.
- National Highway Traffic Safety Administration, “NHTSA Estimates Traffic Fatalities Declined in the First Half of 2024.” Accessed March 18, 2025.
- Governors Highway Safety Association, “Teens & Novice Drivers.” Accessed March 18, 2025.
- Governors Highway Safety Association, “Distracted Driving.” Accessed March 18, 2025.
- Montana Legislative Services, “SB 359: Revise traffic laws related to distracted driving.”Accessed March 18, 2025.
- KTVQ, “Safe driving organization engages Billings students in traffic safety initiatives.” Accessed March 18, 2025.
- Governors Highway Safety Association, “Safe Youth Mobility Grant Results: Montana.” Accessed March 18, 2025.
- Missouri Department of Transportation, “Show-Me Zero: Driving Missouri Toward Safer Roads.”Accessed March 18, 2025.
- Oklahoma Department of Transportation, “More than 63,500 Oklahoma teens take part in first year of Work Zone Safe safety course law.”Accessed March 18, 2025.
- AAA Foundation for Traffic Safety, “Teen Driver Risk in Relation to Age and Number of Passengers.” Accessed March 18, 2025.
- Insurance Institute for Highway Safety, “Fatality Facts 2022: Teenagers.” Accessed March 18, 2025.
- U.S. Centers for Disease Control and Prevention, “Risk Factors for Teen Drivers.” Accessed March 18, 2025.
Figures