What states have the highest rates of drunk driving?
+1 more

Every 40 minutes, someone in the U.S. dies because of a drunk driver. Despite decades of public awareness campaigns and stricter DUI laws, drunk driving claimed more than 13,000 lives in 2022 alone. While national efforts have reduced drunk driving incidents over the past 30 years, the problem remains persistent.
To stay safe, drivers can take precautions like avoiding high-risk situations and ensuring they have adequate car insurance to protect themselves and their vehicles in case of an accident. However, it’s equally important to understand where drunk driving is most prevalent and how it impacts safety on the roads.
We identified the states with the highest rates of drunk driving by analyzing data on DUI-related fatalities and arrest rates. Keep reading to see where your state stands.
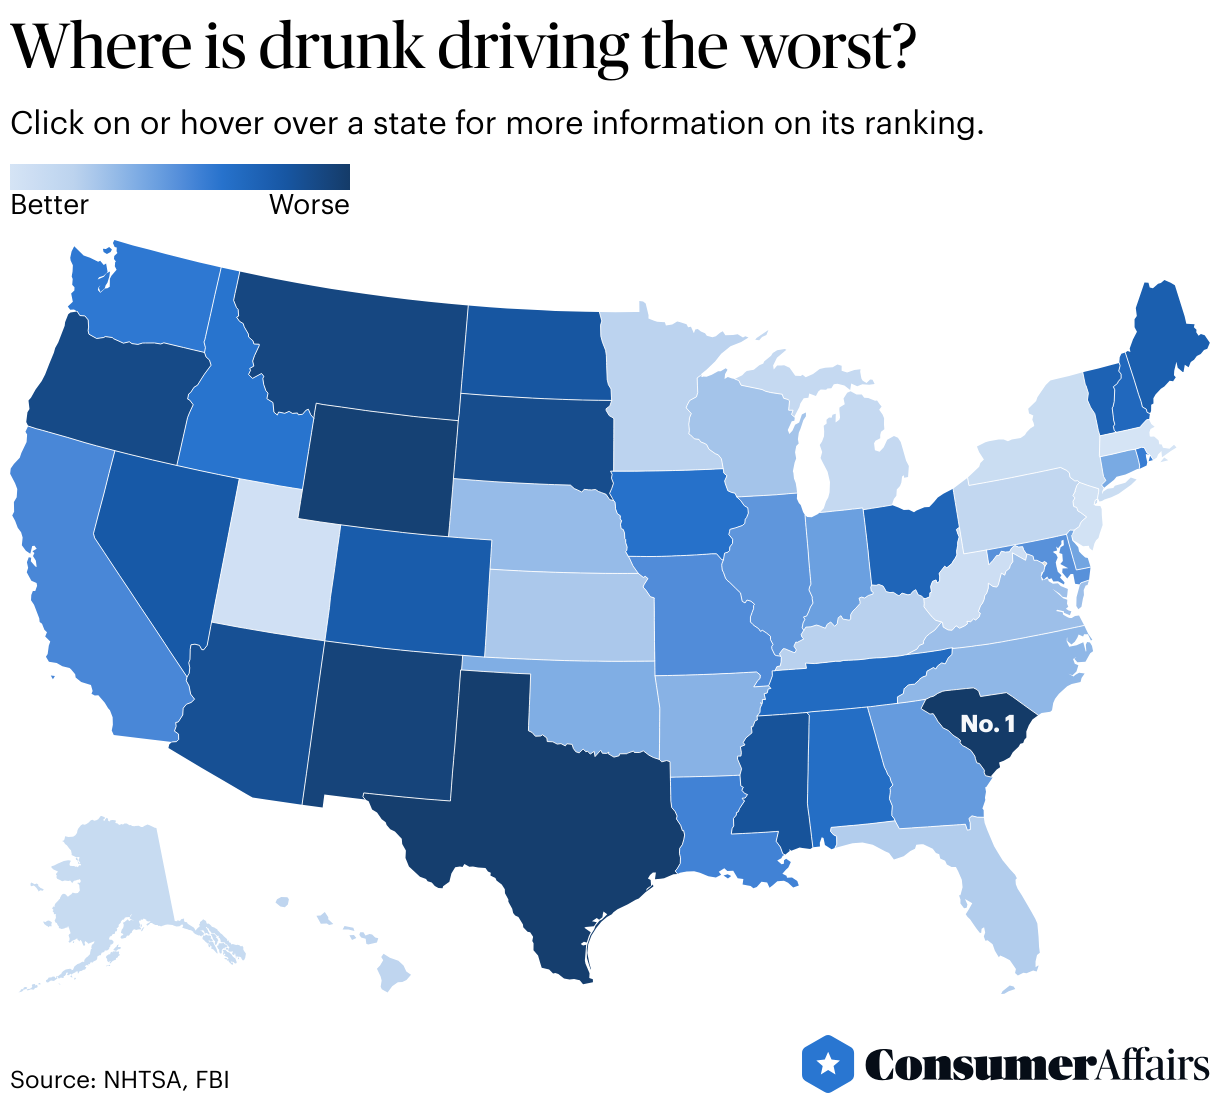
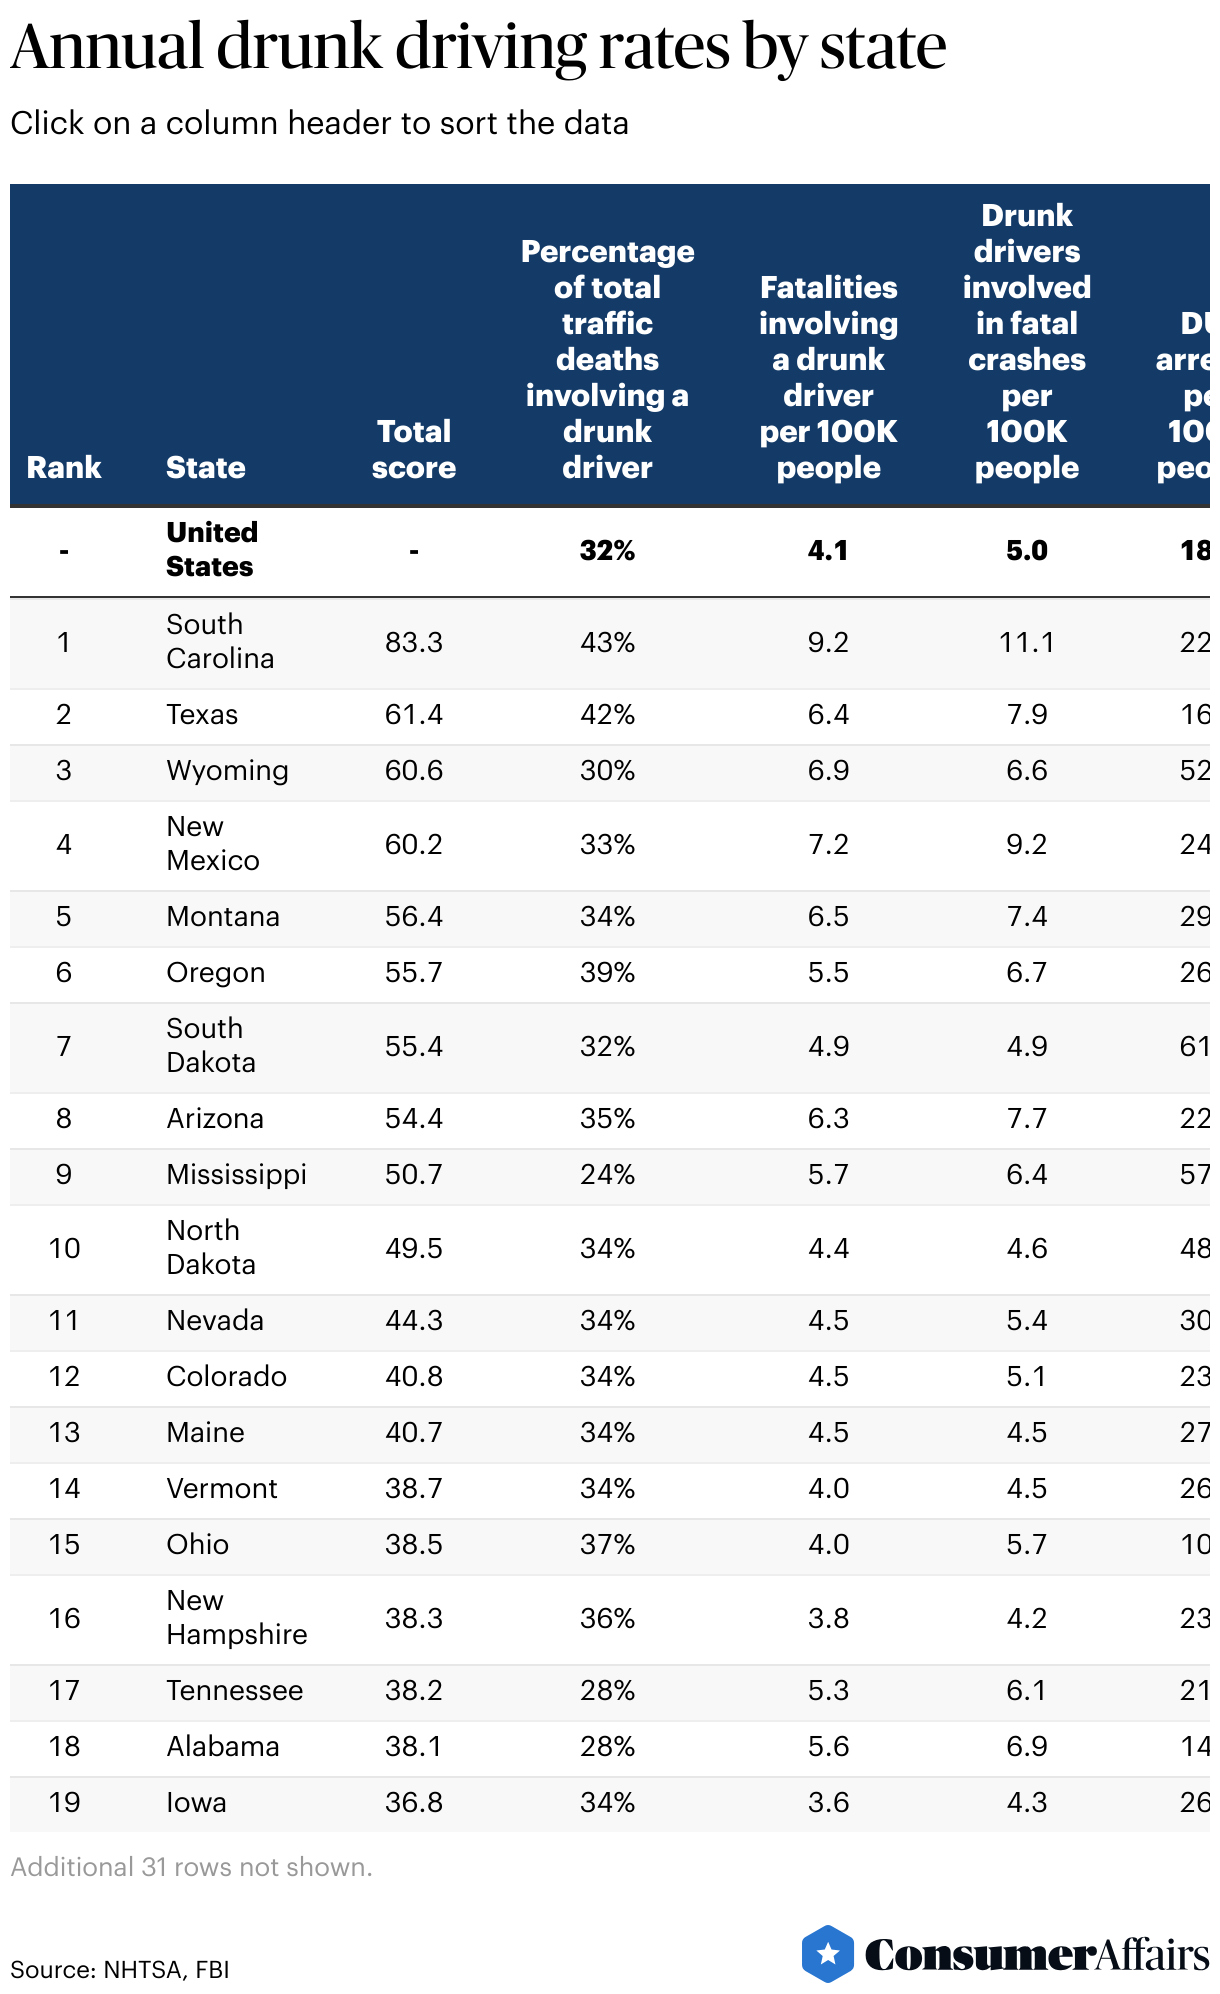
South Carolina had the highest rate of drunk driving-related deaths in the U.S. in 2022, with 9.2 deaths per 100,000 people in 2022.
Jump to insightMassachusetts had the lowest rate, with 1.8 deaths per 100,000 people in 2022 — less than half the national average.
Jump to insightSouth Dakota had the highest rate of DUI arrests in 2023, at 61.4 arrests per 100,000 people, more than three times the national average.
Jump to insightHalf of the 10 worst states for drunk driving are in the West: Wyoming, New Mexico, Montana, Oregon and Arizona.
Jump to insightIs drunk driving getting worse?
Drunk driving has been a public safety concern for decades, leading to stricter laws and public awareness campaigns. But has the problem improved, or is it getting worse?
To answer this question, we analyzed 30 years of FBI data on DUI arrests. What the data reveals may surprise you.
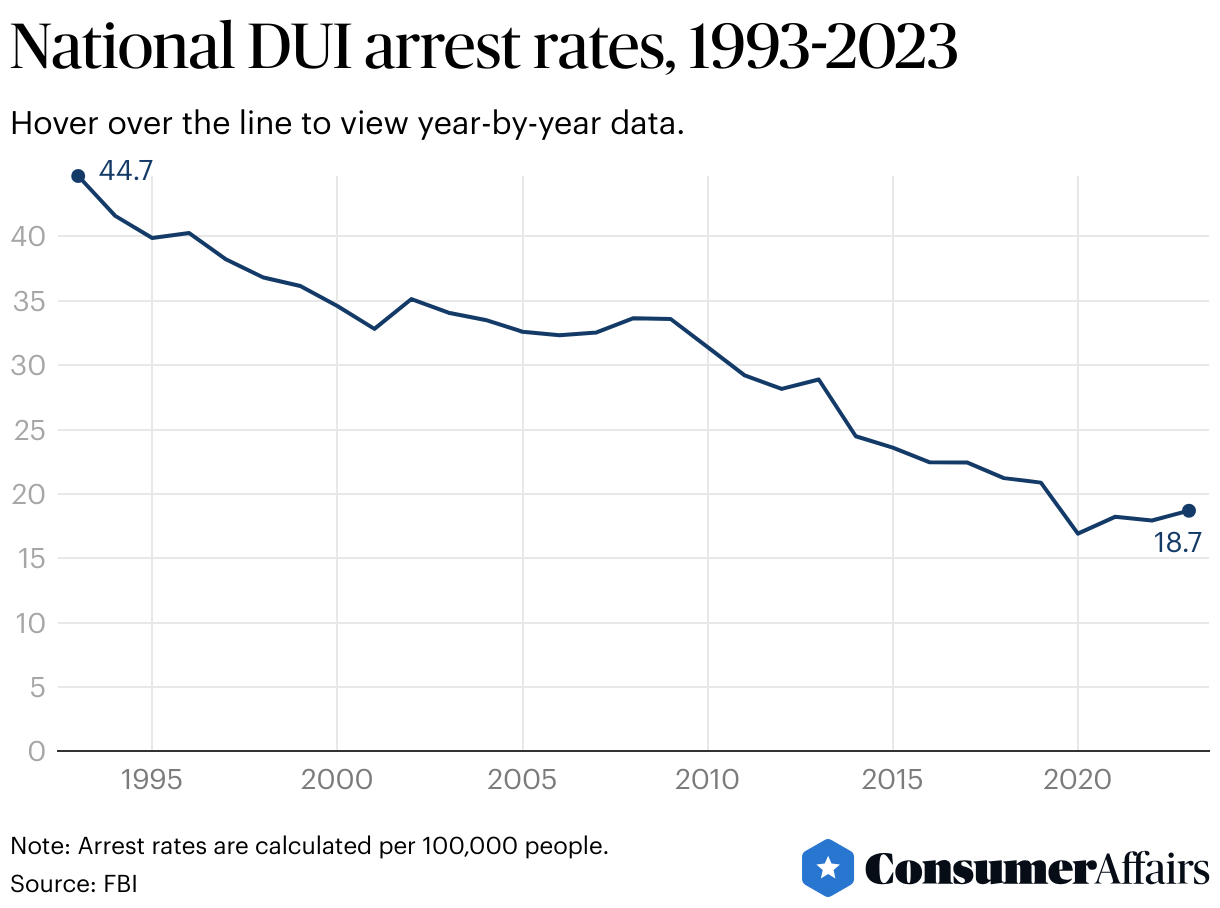
Since the early 1990s, the rate of DUI arrests has plummeted across the United States, though since 2020, arrests have remained the same or ticked up in many states after a decrease in arrests early in the COVID-19 pandemic.
The overall decline over the past 30 years has been driven by increased public education on the issue and harsher and more consistent punishments. It was not until the early 2000s that a blood alcohol content (BAC) of .08% or higher became the standard for impaired driving.
Still, despite the decline in arrests, drunk drivers continue to pose significant danger on the roadways. In 2021 and 2022, more than 13,000 people died in crashes involving a drunk driver, marking the highest numbers since 2007 and a significant increase over the fewer than 10,000 deaths recorded in 2014.
Five worst states for drunk driving
About one-third of all traffic fatalities in the U.S. involve drunk drivers, according to the National Highway Traffic Safety Administration. While every state works to address this issue, DUIs vary significantly nationally, with higher rates of DUIs and traffic fatalities concentrated in the Southern and Western regions of the country.
1. South Carolina
83.3 out of 100 points
Despite falling in the middle of the pack for its rate of DUI arrests, South Carolina had by far the greatest rate of fatalities stemming from crashes involving a drunk driver in 2022.
The state’s notoriety for that ranking has sparked efforts to tighten South Carolina’s DUI laws.
"I think we have to trace our nation's worst drunk driving problem in South Carolina directly back to the state of our laws," Steven Burritt, a regional executive director with Mothers Against Drunk Driving, told WCNC in Charlotte, North Carolina, this year.
Advocates in the state are pushing for a bill during the state’s upcoming legislative session to eliminate a requirement for dashcam video in DUI convictions.
- Percentage of traffic deaths involving a drunk driver: 43% (first in the U.S.)
- Number of fatalities involving a drunk driver per 100,000 people: 9.2 (first)
- Number of DUI arrests per 100,000 people: 22 (27th)
- Number of drunk drivers involved in fatal crashes per 100,000 people: 11.1 (first)
2. Texas
61.4 out of 100 points
Alongside South Carolina and Rhode Island, Texas was the only other state in 2022 where more than 40% of traffic deaths involved a drunk driver. This problem has extended to underage drivers in Texas, as the state recorded the highest rate of drivers under 21 involved in deadly crashes, at 1.5 per 100,000 people.
While the statistic involving underage drunk drivers was not a factor in our overall ranking, Texas’ position atop that data underscores the state’s struggles with keeping roads safe from impaired drivers, even as fewer Texans are arrested for driving under the influence than those in many other states.
- Percentage of traffic deaths involving a drunk driver: 42% (third in the U.S.)
- Number of fatalities involving a drunk driver per 100,000 people: 6.4 (fifth)
- Number of DUI arrests per 100,000 people: 16.7 (37th)
- Number of drunk drivers involved in fatal crashes per 100,000 people: 7.9 (third)
3. Wyoming
60.6 out of 100 points
Despite having the smallest population in the nation, Wyoming ranked well for both drunk driver-involved fatalities and DUI arrests.
While alcohol use contributes to these rates, Wyoming faces broader challenges with driver behavior — both sober and impaired. The state ranks as one of the worst for driving in the nation, with a high number of speeding-related fatalities.
- Percentage of traffic deaths involving a drunk driver: 30% (25th in the U.S.)
- Number of fatalities involving a drunk driver per 100,000 people: 6.9 (third)
- Number of DUI arrests per 100,000 people: 52.9 (third)
- Number of drunk drivers involved in fatal crashes per 100,000 people: 6.6 (eighth)
4. New Mexico
60.2 out of 100 points
New Mexico ranks near the top of the nation for its rate of fatalities involving a drunk driver and for the number of drunk drivers involved in fatal crashes.
New Mexico is considered to have lenient DUI laws compared with other states; there is no mandatory minimum jail time for first offenses, while in neighboring Arizona, the mandatory minimum jail time for a first DUI offense is 10 days.
- Percentage of traffic deaths involving a drunk driver: 33% (19th in the U.S.)
- Number of fatalities involving a drunk driver per 100,000 people: 7.2 (second)
- Number of DUI arrests per 100,000 people: 24.3 (18th)
- Number of drunk drivers involved in fatal crashes per 100,000 people: 9.2 (second)
5. Montana
56.4 out of 100 points
Rounding out the top five is another state in the Mountain West. Montana ranks highly due to high rates of deaths in crashes involving a drunk driver, DUI arrests and drunk drivers involved in fatal crashes.
Despite the high number of arrests, advocacy groups like Mothers Against Drunk Driving have been critical of the state’s driving laws. In 2019, the group gave the state 0.5 stars out of 5 for its DUI laws, the worst rating in the nation.
- Percentage of traffic deaths involving a drunk driver: 34% (12th in the U.S.)
- Number of fatalities involving a drunk driver per 100,000 people: 6.5 (fourth)
- Number of DUI arrests per 100,000 people: 29.5 (ninth)
- Number of drunk drivers involved in fatal crashes per 100,000 people: 7.4 (fifth)
Annual drunk driving rates by state
While some states continue to struggle with higher rates of DUIs and fatalities involving drunk drivers, the past 30 years have seen states make significant progress. In 2023, there were fewer than half as many DUI arrests per 100,000 people recorded nationally as there were in the early 1990s.
Expert insights

Kathleen Lenk
Research professional, epidemiology and community health, University of Minnesota
Kathleen Lenk
Research professional, epidemiology and community health, University of MinnesotaSome reasons impaired driving rates may vary across states include:
- Differences in state laws, such as the severity of penalties for impaired driving, mandatory minimum penalties for impaired driving violations, restrictions on alcohol retailers (e.g., locations, number/density per geographic unit), whether sobriety checkpoints are allowed, etc.
- Differences in level of enforcement, such as how often law enforcement conducts saturation patrols to target impaired driving and whether enforcement agencies have dedicated alcohol enforcement divisions or personnel. This, of course, can be directly related to levels of funding for enforcement efforts, which can vary by state.
- Differences in drinking culture can vary across states and can be influenced by religiosity, historical norms, etc.

James Fell
Principal research scientist, justice and society economics, University of Chicago
James Fell
Principal research scientist, justice and society economics, University of ChicagoThat could be due to a number of factors. Traffic safety reasons include as examples:
- tougher DWI laws;
- highly visible, frequent and publicized impaired driving enforcement, especially the use of sobriety checkpoints;
- alcohol ignition interlocks installed in all cars of convicted DWI offenders;
- the safety culture in the state where impaired driving is socially unacceptable, and transportation alternatives are available (e.g., ride-sharing).
James Lange
Assistant professor, global health management, San Diego State University
James Lange
Assistant professor, global health management, San Diego State UniversityThere are a number of possible reasons for states to differ on drinking and driving rates. For instance, a lot of our understanding of the rate of drunk driving comes from crash statistics. Serious crashes, especially those that involve fatalities, are more often reported in national data sets. For a number of reasons, rural area crashes are more likely to include a fatality. This could be because of the time it takes for medical help to arrive. So if a drunk driver in a city survives a crash and a rural drunk driver does not, it would appear from the data that the rural area has a drunk driver, while the city driver is absent.
Other reasons a state may differ are the driving and the drinking cultures. Also, it can be that enforcement and post-conviction action differ by state. There are some successful ways of avoiding recidivism. For instance, installing interlock devices can help. If a state successfully enforces the laws, and the courts use best practices to avoid recidivism, that could lead to lowering the rates.
Read their bio
Nicholas Wright
Assistant professor, economics, Florida International University
Nicholas Wright
Assistant professor, economics, Florida International UniversityThe literature highlights several factors that may influence alcohol consumption and the propensity to drink and drive across the United States. These include population demographics, weather shocks, holiday variability, the price and availability of alcohol (e.g., prevalence of bars and liquor stores), the stringency and enforcement of DUI-related laws (e.g., zero-tolerance laws, sobriety checkpoints, DUI penalties), laws restricting alcohol sales and consumption locations, the probability of conviction for drunk driving offenses, the cost and availability of alternative transportation, public safety campaigns, and social and cultural norms related to alcohol use (e.g., tourist hot spots).
Read their bio
Frank Sloan
Professor, economics, Duke University
Frank Sloan
Professor, economics, Duke UniversityPeople, if anything, overestimate the risks of drunk driving. More specifically, they substantially overestimate the risk of being pulled over by police after having too much to drink. In my opinion, counseling patients on the risks of drunk driving alone is a waste of time. Patients need help with cutting down on alcohol consumption, particularly when they intend to drive. Heavy and binge drinking is highly correlated with drunk driving.
Read their bio
Benjamin Hansen
Professor, economics, University of Oregon
Benjamin Hansen
Professor, economics, University of OregonPeople with alcohol abuse problems and addiction are so used to feeling buzzed or drunk, they don't realize how impaired they really are in the moment. The average BAC (blood alcohol concentration) in a fatal crash is close to 0.15, or about double the legal limit.
This highlights the problem that dangerous drunk driving is largely driven by people well over the legal limit. Those drivers probably also engage in base rate biases. They drive home once and nothing bad happens. This lulls them into a feeling of safety, and they assume this means it's safe to drive impaired. But sooner or later, their reckless driving eventually catches up with them through interactions with the law or a dangerous crash. Those consequences follow them for the rest of their lives through criminal charges, higher insurance rates and emotional guilt.
Read their bio
Andrew Yockey
Assistant professor, public health, University of Mississippi
Andrew Yockey
Assistant professor, public health, University of MississippiThe level of impairment after drinking is often underestimated because people may feel fine due to alcohol tolerance — not recognizing subtle impairments like slowed reaction times or poor judgment. Additionally, alcohol’s effects peak after a delay, so individuals may feel OK initially but become more impaired over time. People also tend to underestimate their BAC, not realizing how it affects their abilities.
Read their bioJames Lange
Assistant professor, global health management, San Diego State University
James Lange
Assistant professor, global health management, San Diego State UniversityA drunk person is often not the best judge of their own impairment. Indeed, it usually takes many instances of impaired driving before an incident occurs, which may bolster the fallacy that they can get away with it. There are social aspects of this as well. It could be that a group that is out drinking may not want to admit that they’re as impaired as they actually feel. This is why we recommend that if you are planning on drinking, you consider getting to the venue in a manner that already assumes alcohol will be consumed. Basically, make the plan to get home before leaving the house.
Read their bioMethodology
To determine the states with the highest rates of drunk driving, we analyzed four metrics in all 50 states. Each metric was weighted 25%. The state with the highest number in each category was given a score of 25 points; other states were scored relative to how their numbers compared with the highest number. We then added the scores together to get a final score, which is out of 100. We used population figures from the U.S. Census Bureau.
- Percentage of total traffic deaths caused by drivers with a BAC of 0.08% or higher (over the legal limit), using 2022 data from the NHTSA
- Number of people killed in crashes involving a drunk driver per 100,000 people, using 2022 data from the NHTSA
- Number of DUI arrests per 100,000 people, using 2023 data from the FBI
- Number of drunk drivers involved in fatal crashes per 100,000 people, using 2022 data from NHTSA
We also collected supplementary data for our story, including the number of underage drunk drivers per 100,000 people by state (NHTSA, 2022) and 30-year national DUI arrest rates per 100,000 people (FBI, 1993-2023). These metrics were not factored into our overall ranking.
For questions about the data or if you'd like to set up an interview, please contact acurls@consumeraffairs.com.
Reference policy
We love it when people share our findings! If you do, please link back to our original article to credit our research.
Article Sources
ConsumerAffairs writers primarily rely on government data, industry experts and original research from other reputable publications to inform their work. Specific sources for this article include:
- National Highway Traffic Safety Administration, “Fatality Analysis Reporting System (FARS).” Accessed Jan. 8, 2025.
- National Highway Traffic Safety Administration, “Drunk Driving.” Accessed Jan. 13, 2025.
- U.S. Census Bureau, “Explore Census Data.” Accessed Jan. 8, 2025.
- FBI, “Crime Data Explorer.” Accessed Jan. 8, 2025.
- National Highway Traffic Safety Administration, “0.08 BAC Sanction.” Accessed Jan. 13, 2025.
- National Highway Traffic Safety Administration, “Persons Killed, by Highest Driver Blood Alcohol Concentration (BAC) in the Crash, 1994 - 2022 - State : USA.” Accessed Jan. 4, 2025.
- WCNC-TV, “South Carolina leads the nation in deadly drunk driving. A new bill hopes to fix it.” Accessed Jan. 8, 2025.
- Mothers Against Drunk Driving, “MADD Rates all 50 States on Drunk Driving Laws.” Accessed Jan. 8, 2025.
- Arizona Department of Transportation, “Driving Under the Influence (DUI).” Accessed Jan. 8, 2025.
- NMOneSource.com, “66-8-102. Driving under the influence of intoxicating liquor or drugs; aggravated driving under the influence of intoxicating liquor or drugs; penalties.” Accessed Jan. 13, 2025.
Figures