Greenest states in the U.S.
+1 more

The impact of climate change on everything — our economy, health and daily lives — has become undeniable. Lawmakers in almost every state recognize the need to shift from fossil fuels to renewable energy sources to reduce carbon emissions. However, not all states share the same level of urgency.
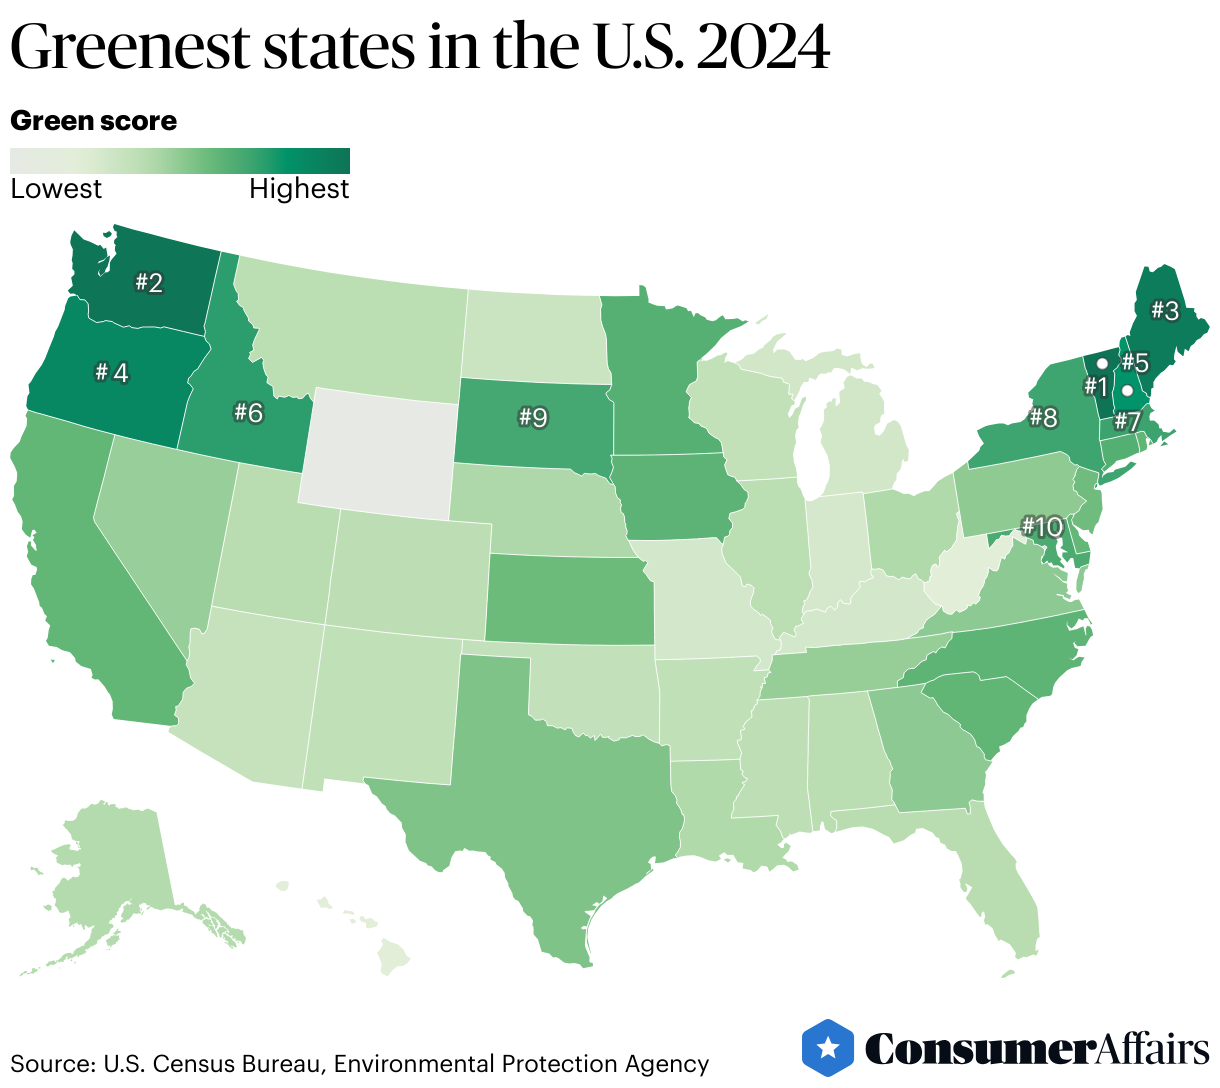
The ConsumerAffairs Research Team ranked the most eco-friendly states of 2024 based on renewable energy generation, greenhouse gas emissions and other factors. Read our full methodology for more details on how we calculated each state’s Green score.
Vermont is the greenest state, according to our scoring system, followed by Washington, Maine, Oregon and New Hampshire, in 2024.
Jump to insightWyoming is the least green state, followed by West Virginia, Hawaii, Indiana and Missouri, in 2024.
Jump to insightHawaii has the best air quality, followed by Washington, Alaska, Maine and Oregon.
Jump to insightGreenest states
The ConsumerAffairs Research Team aggregated the latest publicly available data to find out which states are doing the most to combat the climate crisis in 2024.
How does your state rank? We rated all 50 states on environmental friendliness to calculate their Green scores.
1. Vermont
The Green Mountain State lives up to its name in 2024. Vermont had the lowest emissions per capita, and nearly 100% of its electricity comes from renewable energy sources — more than any other state can claim.
Vermonters do have a reputation for being environmentally friendly, and it’s true they recycle more than average. “Our economy is very tied to natural resources, from our seasonal recreation businesses to farming, and there seems to be a prevailing sense that those resources require some protection,” said Jennifer Rushlow, dean of the Maverick Lloyd Vermont School for the Environment at Vermont Law and Graduate School.
But it’s more complicated than that at the political level, according to Rushlow. Last year, Gov. Phil Scott vetoed the Affordable Heat Act, only to be overridden by state lawmakers. Rushlow said that Vermont’s environmental leadership is a mixed bag, particularly when it comes to addressing the climate crisis.
What makes Vermont the greenest state?
- Generates 99.6% of its energy from renewable resources — by far the most in the U.S.
- Lowest carbon emissions per capita
- Least amount of municipal solid waste (MSW) generated
» MORE: Vermont solar incentives
2. Washington
Washington stands out for its significant overall renewable energy production. The Evergreen State also had one of the best air quality scores, according to our analysis of the Environmental Protection Agency’s air quality index (AQI) data.
The state’s last coal-fired power plant, in the city of Centralia, will close in 2025. The power plant’s closure is a step toward a fully green electricity grid, according to The Seattle Times: “The new technologies may provide a way for Centralia to remain a town of electricity generation, but in a greener way, and continue to fuel the state’s grid.”
Despite its reputation for cloudy skies, there are actually tons of solar incentives in Washington, including tax credits and net metering. One resident, Kimbal in Friday Harbor, told us that they “invested in a solar energy system for our home because of environmental and utility cost benefits,” and now offsets 100% of their yearly electric grid consumption with solar panels.
What makes Washington one of the greenest states?
- Second-best for renewable energy generation
- Relatively low carbon emissions per capita
- Highest percentage of recycled and composted waste
3. Maine
Maine wins in terms of recycling. It also has the second-lowest percentage of landfill waste of all states. The Natural Resources Council of Maine advocates for policies to improve air quality and reduce pollution. In 2021, according to NRCM, Maine became the very first state to pass a law that charges corporations for recycling consumer packaging.
The Pine Tree State is aiming for 100% renewable energy usage by 2050 with a nearer-term goal of 80% by 2030. It currently generates about 63% of its energy from renewable resources.
What makes Maine one of the greenest states?
- Recycles 47.7% of waste, the highest percentage of any state
- Third-lowest annual carbon dioxide emissions
- Only about 15% of waste ends up in landfills (the U.S. average is close to 70%)
» EXPLORE: Maine solar incentives
4. Oregon
Oregon has one of the lower per-capita carbon footprints in the country. Over two-thirds of its energy generation is from renewables, and its residents are much better than average when it comes to recycling, composting and producing low amounts of waste.
Oregon is also one of the best states for going solar. Its renewable portfolio standard requires that 50% of the state's electricity use come from renewable resources by 2040, so there are plenty of solar incentives there.
What makes Oregon one of the greenest states?
- Generates 68.8% of its energy from renewable resources
- Carbon emissions per capita are less than 50% of the national average
- Recycling rate (36.5%) is about two times the national average
5. New Hampshire
New Hampshire ranks well in all the criteria investigated and rounds out the top five greenest states. Green manufacturing has been a significant focus in New Hampshire. The state produces most of its renewable energy from hydroelectric power, biomass and wind.
The Granite State has the second-highest tree equity score (a measure of how well benefits of trees are reaching communities disproportionately affected by extreme heat and other environmental hazards).
What makes New Hampshire one of the greenest states?
- Relatively low state annual carbon output emission rate
- High recycling rate
- Second-highest tree equity score in the country
Greenest states, ranked
To rank the states from most to least eco-friendly, we compared factors such as the percentage of energy produced from renewable sources, carbon emission rates, waste recycling measures and other metrics. States earned a score from 0 to 10 for each metric, and scores were combined to create a Green score. Read our full methodology for more details.

Bottom line
Scientists, philosophers and economists agree on the importance of reducing carbon emissions. The urgency to transition to renewables is gaining momentum nationwide, and (some) states are taking significant steps toward this charge.
Everyone can do their part — you could get solar panels or an energy-efficient mortgage and follow our tips on saving energy at home — but our future also depends in large part on our lawmakers and corporations.
Methodology
ConsumerAffairs evaluated several critical metrics from the Environmental Protection Agency, U.S. Census Bureau and other sources to determine the greenest states. States earned a score from 0 to 10 on each metric. Then, we combined the scores for these metrics to create a Green score to rank each state. For each metric, we gathered data from the most recently available year.
- State total renewables generation: Renewables are inexhaustible energy resources such as biomass, wind, solar, geothermal and hydro. We looked at each state’s annual total renewables net generation in megawatt hours (MWh) using federal data from 2022. The total renewables resource mix is expressed as a percent of the state’s annual net generation. “Resource mix” means generating a certain fuel or resource type divided by total generation.
- State total nonrenewable generation: Nonrenewables are exhaustible energy resources such as coal, oil, gas, other fossil fuels and nuclear power. We factored in the state's annual total nonrenewable net generation in MWh using federal data from 2022. The total nonrenewable resource mix is expressed as a percent of the state's annual net generation. States with higher nonrenewable generation of these fuels scored lower.
- Tree equity score: This measures how readily available the benefits of urban tree canopies are to residents. It combines information from various sources to create a single measure from 0 to 100. The higher the score, the better. Data is from 2023.
- Bad air score: Based on the Environmental Protection Agency’s air quality index (AQI) data for metropolitan statistical areas, we developed a formula to calculate a “bad air score” for each state. Data is from 2023.
- State annual CO2 equivalent emissions: We considered each state's annual CO2 equivalent emissions in tons, the annual rate of CO2 equivalent emissions per MWh generated in pounds and emissions per capita. Data is from 2022.
- MSW generation: We looked at the total amount of municipal solid waste (MSW) generated and produced per capita. Data for solid waste and recycled, composted, combused and landfilled waste is from 2011.
- Percentage of waste recycled or composted: States that recycled and composted at a higher rate scored higher.
- Percentage of waste combusted or landfilled: States that combusted or landfilled waste at a higher rate scored lower.
For questions about the data or if you'd like to set up an interview, please contact acurls@consumeraffairs.com.
Article sources
ConsumerAffairs writers primarily rely on government data, industry experts, and original research from other reputable publications to inform their work. Specific sources for this article include:
- U.S. Census Bureau, “Measuring America's People, Places, and Economy.” Accessed April 10, 2024.
- Environmental Protection Agency, “Download Data.” Accessed April 10, 2024.
- Environmental Protection Agency, “Pre-Generated Data Files.” Accessed April 10, 2024.
- Columbia University Earth Engineering Center, “Generation and Disposition of Municipal Solid Waste (MSW) in the United States–A National Survey.” Accessed April 10, 2024.
- Environmental Protection Agency, “The Emissions & Generation Resource Integrated Database.” Accessed April 10, 2024.
- Ball Corporation, “The 50 States of Recycling.” Accessed April 10, 2024.
- Environmental Protection Agency, “Our Nation's Air: Trends Through 2022.” Accessed April 10, 2024.
- Environmental Protection Agency, “Our Nation's Air 2023: Air Quality Improves as America Grows.” Accessed April 10, 2024.
- American Forests, “Tree Equity Score.” Accessed April 10, 2024.
Figures