Metros with the Worst Housing Shortages 2026
+1 more

Picture this: You’ve done your research, identified your “must-haves” and gotten your finances in order. You’re even ready to sign with a mortgage lender. But you can't find the right house for you. It’s not for lack of looking — there just aren’t any houses on the market in your neighborhood.
Sound familiar? As homebuilding has slowed and demand has stayed high, many metro areas now face tight housing markets, presenting a difficult challenge for those ready to pursue homeownership.
To identify the U.S. metros with the greatest housing shortages, the ConsumerAffairs Research Team calculated the number of available housing units per 1,000 households across the 200 most populous metro areas. Read on to see if your city made the list.
The Provo, Utah, metro area faces the nation’s worst housing shortage, with just 13.8 available units per 1,000 households.
Jump to insightBy contrast, Asheville, North Carolina, has the greatest supply, with 132.4 units per 1,000 households.
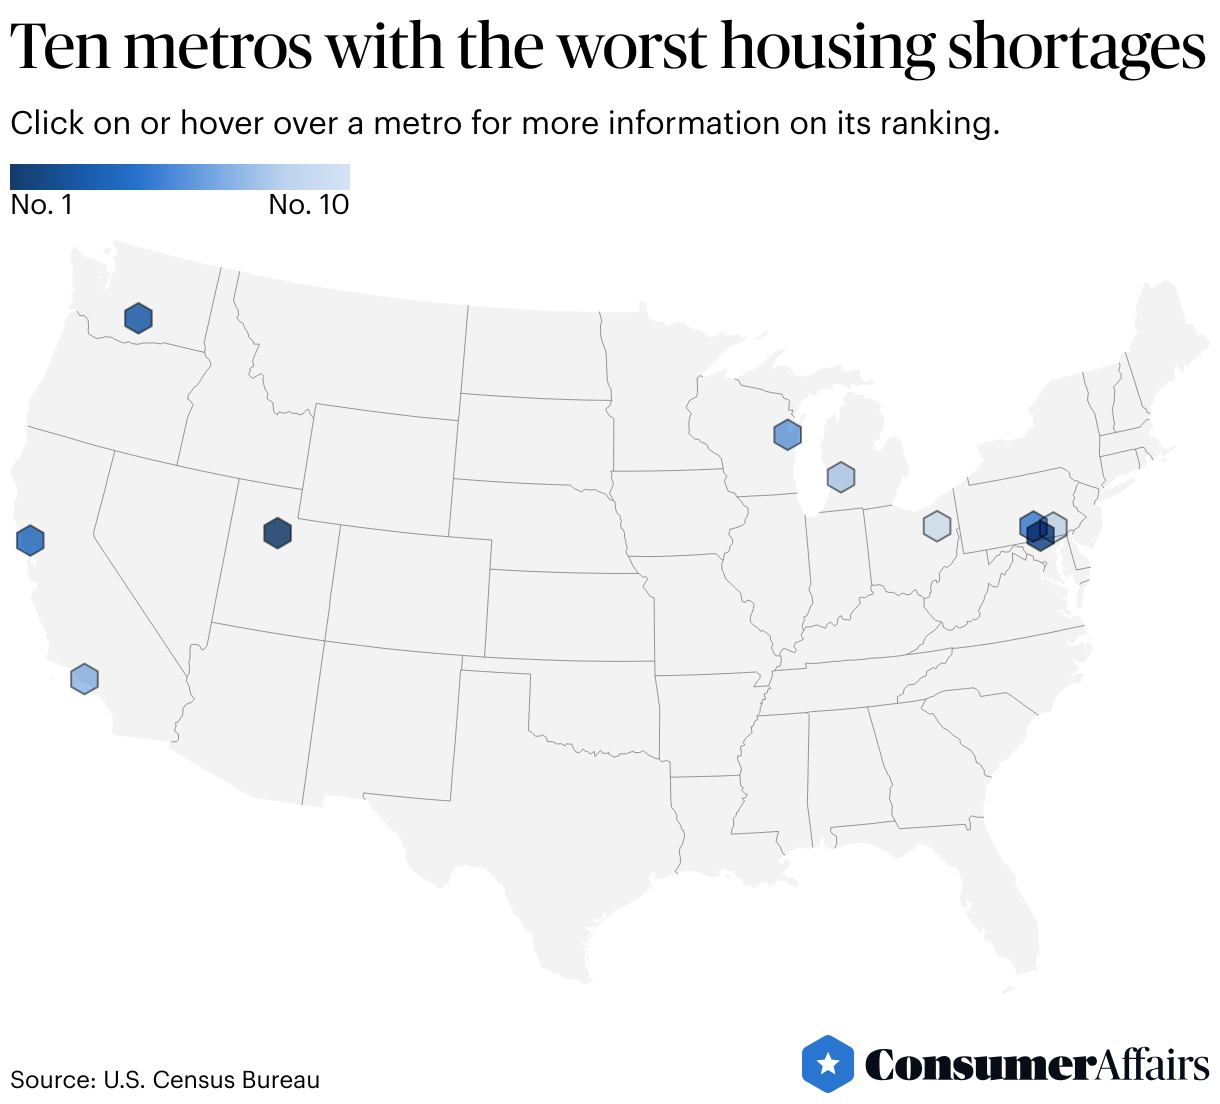
Jump to insightFour of the 10 metros with the steepest housing deficits are in the West.
Jump to insightMeanwhile, nine of the 10 metros with the most abundant supply are in the South.
Jump to insightTen metros with the worst housing shortages
Multiple regions of the U.S. are represented in the top 10 list, but one region is slightly more represented than the others: Four of the 10 metros with the steepest housing deficits are in the West. On the opposite side of the country, Pennsylvania is the most-represented state, with three metro areas in the top 10.
Check out the map below for an overview, then dive deeper with a closer look at each of the top-ranked cities.
1. Provo, Utah
The Provo-Orem-Lehi metro area faces the nation’s worst housing shortage, with just 13.8 available units per 1,000 households. Compare that with 2018, when there were more than 25 available units per 1,000 households. That’s a decrease of nearly 46% over the past five years of data.
While housing supply is tight, homebuilding in Provo hasn’t stopped: More than 3,700 building permits were issued in June 2025 as builders try to keep up with demand. Interestingly, the housing shortage doesn’t seem to be barring young adults from buying homes. Provo is one of the U.S. cities where homeownership is most accessible to young people.
2. York, Pennsylvania
The York-Hanover metro area lands just a hair behind top-ranked Provo, with 13.9 available housing units per 1,000 households. Over the previous five years, the supply of available housing units per household decreased by 34%.
Interestingly, a recent housing gap analysis conducted by the York County Economic Alliance found that a large share of homeowners in York County (which contains York, Hanover and several other boroughs) are living below their means when it comes to housing — that is, they’re living in homes that cost less than what they can afford. While this may be a boon for those homeowners currently occupying more affordable houses, it further tightens the supply for those who can afford less.
3. Yakima, Washington
Yakima, located about 70 miles southeast of Mount Rainier, takes third rank for the cities with the worst housing deficits. Vacancy rates are extremely low — less than 2% for both apartments and homes, according to the City of Yakima.
Over five years, the supply of available housing units has fallen by nearly half (49.8%), and the number of available housing units per household has fallen even further (53.2%). While those metrics aren’t the worst in the nation, they’re the largest changes among the 10 cities with the biggest housing shortages overall.
4. Santa Rosa, California
In the Santa Rosa-Petaluma metro, there are about 15.8 available housing units per 1,000 households, giving the metro the fourth-worst housing shortage in the country. That’s a decrease of more than 28% compared with five years prior.
However, recent statewide legislative changes may bode well for the housing supply in Santa Rosa. In June 2025, Gov. Gavin Newsom rolled back the California Environmental Quality Act, a law that required environmental review for housing developments. While not everyone in Sonoma County (home of Santa Rosa) is pleased, local housing advocates and developers alike are optimistic about what the loosened restrictions could mean for more homebuilding.
5. Harrisburg, Pennsylvania
The Keystone State has another metro area in the top five for housing deficits. The housing supply in the Harrisburg-Carlisle metro area has fallen by nearly a third (32.1%) since 2018. Now, Harrisburg has just 16.3 available housing units per 1,000 households — the fifth-largest deficit of all the metros we analyzed.
Unfortunately for prospective buyers, homebuilding in Harrisburg is moving particularly slow, with just one building permit issued per 1,000 residents in June 2025.
6. Green Bay, Wisconsin
Green Bay has the worst housing deficit in the Midwest, with just 16.3 available housing units per 1,000 households. That figure has fallen by more than 37% since 2018, a roughly average change among the top 10 metros.
While the housing market has a tight supply, homes that hit the market aren’t necessarily moving quickly. Green Bay ranks near the bottom quarter of U.S. cities with hot housing markets, with homes spending a median of 39 days on the market before selling. (That’s 86% slower than the national median of 21 days.)
7. Oxnard, California
In the Oxnard-Thousand Oaks-Ventura metro area, just 16.4 housing units are available for every 1,000 households. Compare that with 2018, when there were nearly twice as many housing units available (32.1) per 1,000 households.
A tight supply isn’t the only challenge in the housing market in Oxnard. The median gross rent in the area is more than $2,260 a month, and median monthly housing (mortgage) costs exceed $3,000. That puts Oxnard among cities with the steepest “cost of homeownership” in the U.S., with an estimated income of more than $292,000 a year needed to afford a typical home.
8. Grand Rapids, Michigan
The housing supply isn’t so grand in the Grand Rapids-Wyoming-Kentwood area of Michigan. There are only 16.8 available housing units per 1,000 households. That’s partly due to the fact that over five years, the number of households in the area has grown at a double-digit rate (12.3%). The number of available housing units relative to the total number of households has fallen by more than a quarter (25.3%) over that same period.
Similar to top-ranked Provo, Grand Rapids has a high rate of homeownership among people under 35. Its affordability attracts buyers of many ages, but housing supply hasn’t kept pace with that demand.
9. Lancaster, Pennsylvania
Lancaster completes the trio of Keystone State metro areas with a crisis of housing supply. In the Lancaster region, there are only 17 available housing units per 1,000 households.
Notably, over the last five years of data, the housing shortage in Lancaster has worsened at a slower rate than many of the other cities on our list. The number of available housing units relative to the total number of households has decreased by just over 12%. (Compare that with top-ranked Provo, where the same metric has fallen by nearly 46%.)
10. Canton, Ohio
In Canton-Massillon, there are 17.2 available housing units per 1,000 households. From 2018 to 2023, this metric worsened by a staggering 44%.
While housing supply is a problem in Canton, housing affordability doesn’t present such a massive challenge. The median monthly rent is just $887, and the median monthly cost of homeownership is just under $1,280; those are some of the most affordable of all the cities we analyzed.
Where is housing supply outpacing demand?
Our analysis found that Asheville, North Carolina, has the greatest housing surplus: 132.4 available units per 1,000 households.
While the data for our analysis is from 2023 (the latest available), it’s important to acknowledge that Asheville currently faces a particularly complex supply-demand situation, in no small part due to the impact and aftermath of Tropical Storm Helene. The storm damaged nearly 20,000 housing units, with approximately 1,400 units likely needing to be completely replaced. During the second quarter of 2025, home sales in the Asheville region were much slower than the same period the year prior (pre-Helene). Even so, housing affordability remains an issue.
The top 10 metros with the largest housing surpluses are:
- Asheville, North Carolina
- Tyler, Texas
- Lake Charles, Louisiana
- College Station, Texas
- Corpus Christi, Texas
- Champaign, Illinois
- Lubbock, Texas
- Amarillo, Texas
- Baton Rouge, Louisiana
- Wilmington, North Carolina
It’s interesting that several of these cities are major college towns, including College Station (Texas A&M University), Lubbock (Texas Tech University), Baton Rouge (Louisiana State University) and Champaign (University of Illinois Urbana-Champaign). In some college towns, declining enrollment is lowering demand for housing. However, many larger schools are seeing enrollment surge (and demand for housing increase). Provo, Utah, and Grand Rapids, Michigan, are college towns that have some of the largest housing deficits in the nation.
More concrete is the fact that nine of these 10 cities are located in the South — the region that leads the nation in homebuilding.
How does the rest of America's housing supply compare?
Unfortunately, the housing shortage isn’t limited to a handful of metro housing markets. A November 2024 analysis from The Brookings Institution estimates that there’s a shortage of 4.9 million housing units across the U.S.
In another report, Makinizi Hoover, senior manager of strategic advocacy at the U.S. Chamber of Commerce, wrote, “This deficit (is) rooted in a decade of underbuilding following the Great Recession and surging demand from millennials entering prime homebuying years.” Factors like increased construction costs, restrictive regulations and even recent tariffs on imported building materials have contributed to the slowdown in homebuilding and worsening affordability.
So, does your city have a housing shortage — or an unexpected surplus? For a closer look at the data, check out the table below.

Methodology
The ConsumerAffairs Research Team identified the metropolitan areas with the greatest housing shortages by calculating an adjusted vacancy ratio for the 200 most populous U.S. metros. This metric measures the number of available year-round housing units per 1,000 occupied households, using U.S. Census Bureau data from 2018 to 2023.
We excluded vacant units classified as seasonal, recreational or occasional use, as well as housing for migrant workers, to focus on year-round availability. Only units listed as “for rent,” “for sale only,” “rented but not occupied” or “sold but not occupied” were included in the calculation.
Unlike the census’s standard vacancy rate, which divides vacant units by total housing units, our adjusted ratio measures available units per 1,000 households.
We removed the following metros due to boundary shifts between 2018 and 2023:
- Cleveland, OH; Dayton-Kettering-Beavercreek, OH; Kiryas Joel-Poughkeepsie-Newburgh, NY; Waterbury-Shelton, CT; Slidell-Mandeville-Covington, LA; Seaford, DE; Prescott Valley-Prescott, AZ; Lebanon-Claremont, NH-VT
We also removed the following metros due to insufficient data:
- Trenton-Princeton, NJ; Sioux Falls, SD-MN; Merced, CA; Fargo, ND-MN; Kalamazoo-Portage, MI; Santa Cruz-Watsonville, CA; Bend, OR; Appleton, WI; Hilton Head Island-Bluffton-Port Royal, SC; Burlington-South Burlington, VT
We also reviewed how availability has changed over the past five years to identify any larger trends. In addition, we gathered data on building permits per 1,000 residents, median rent, median home sale price and median income. These figures were not included in our shortage calculations but are presented to provide additional context for the story.
Reference policy
We love it when people share our findings! If you do, please link back to our original article to credit our research.
Questions?
For questions about the data or if you'd like to set up an interview, please contact rsowell@consumeraffairs.com.
Article sources
ConsumerAffairs writers primarily rely on government data, industry experts and original research from other reputable publications to inform their work. Specific sources for this article include:
- U.S. Census Bureau, “Explore Census Data.” Accessed Aug. 26, 2025.
- YCEA, “York County Housing Needs and Conditions Assessment.” Accessed Aug. 26, 2025.
- City of Yakima, Washington, “Office of Neighborhood Development Services.” Accessed Aug. 26, 2025.
- The New York Times, “California Rolls Back Its Landmark Environmental Law.” Accessed Aug. 26, 2025.
- Sonoma County Gazette, “Could this law spark a Sonoma County housing boom?” Accessed Aug. 26, 2025.
- Bowen National Research, “Housing Needs Assessment: Asheville Region, North Carolina.” Accessed Aug. 26, 2025.
- Asheville Citizen Times, “Are Asheville home prices rising? Sales slump amid high interest rates, Helene recovery.” Accessed Aug. 26, 2025.
- CRE Daily, “College Towns Enrollment Decline Reshapes Local Economies.” Accessed Aug. 26, 2025.
- The Brookings Institution, “Make it count: Measuring our housing supply shortage.” Accessed Aug. 26, 2025.
- U.S. Chamber of Commerce, “The State of Housing in America.” Accessed Aug. 26, 2025.
Figures