Where are the worst drivers in America?
+1 more
You can do everything right on the road — follow traffic laws, get regular maintenance, even invest in a good extended car warranty. But one reckless driver’s actions can result in a fender bender, a totaled car, a serious injury or a lost life.
The National Highway Traffic Safety Administration (NHTSA) estimated that in 2024, 39,345 people died in traffic crashes in the U.S. While this represents a slight decrease from 2023 (and the first time since 2020 that the total number of fatalities fell below 40,000), the number of lives lost is heartbreakingly high — enough people to fill New York’s Madison Square Garden more than twice over. But where are these fatal crashes occurring the most, and why?
To find out, the ConsumerAffairs Research Team analyzed the latest NHTSA deadly crash data. Keep reading to see if your city made the list.
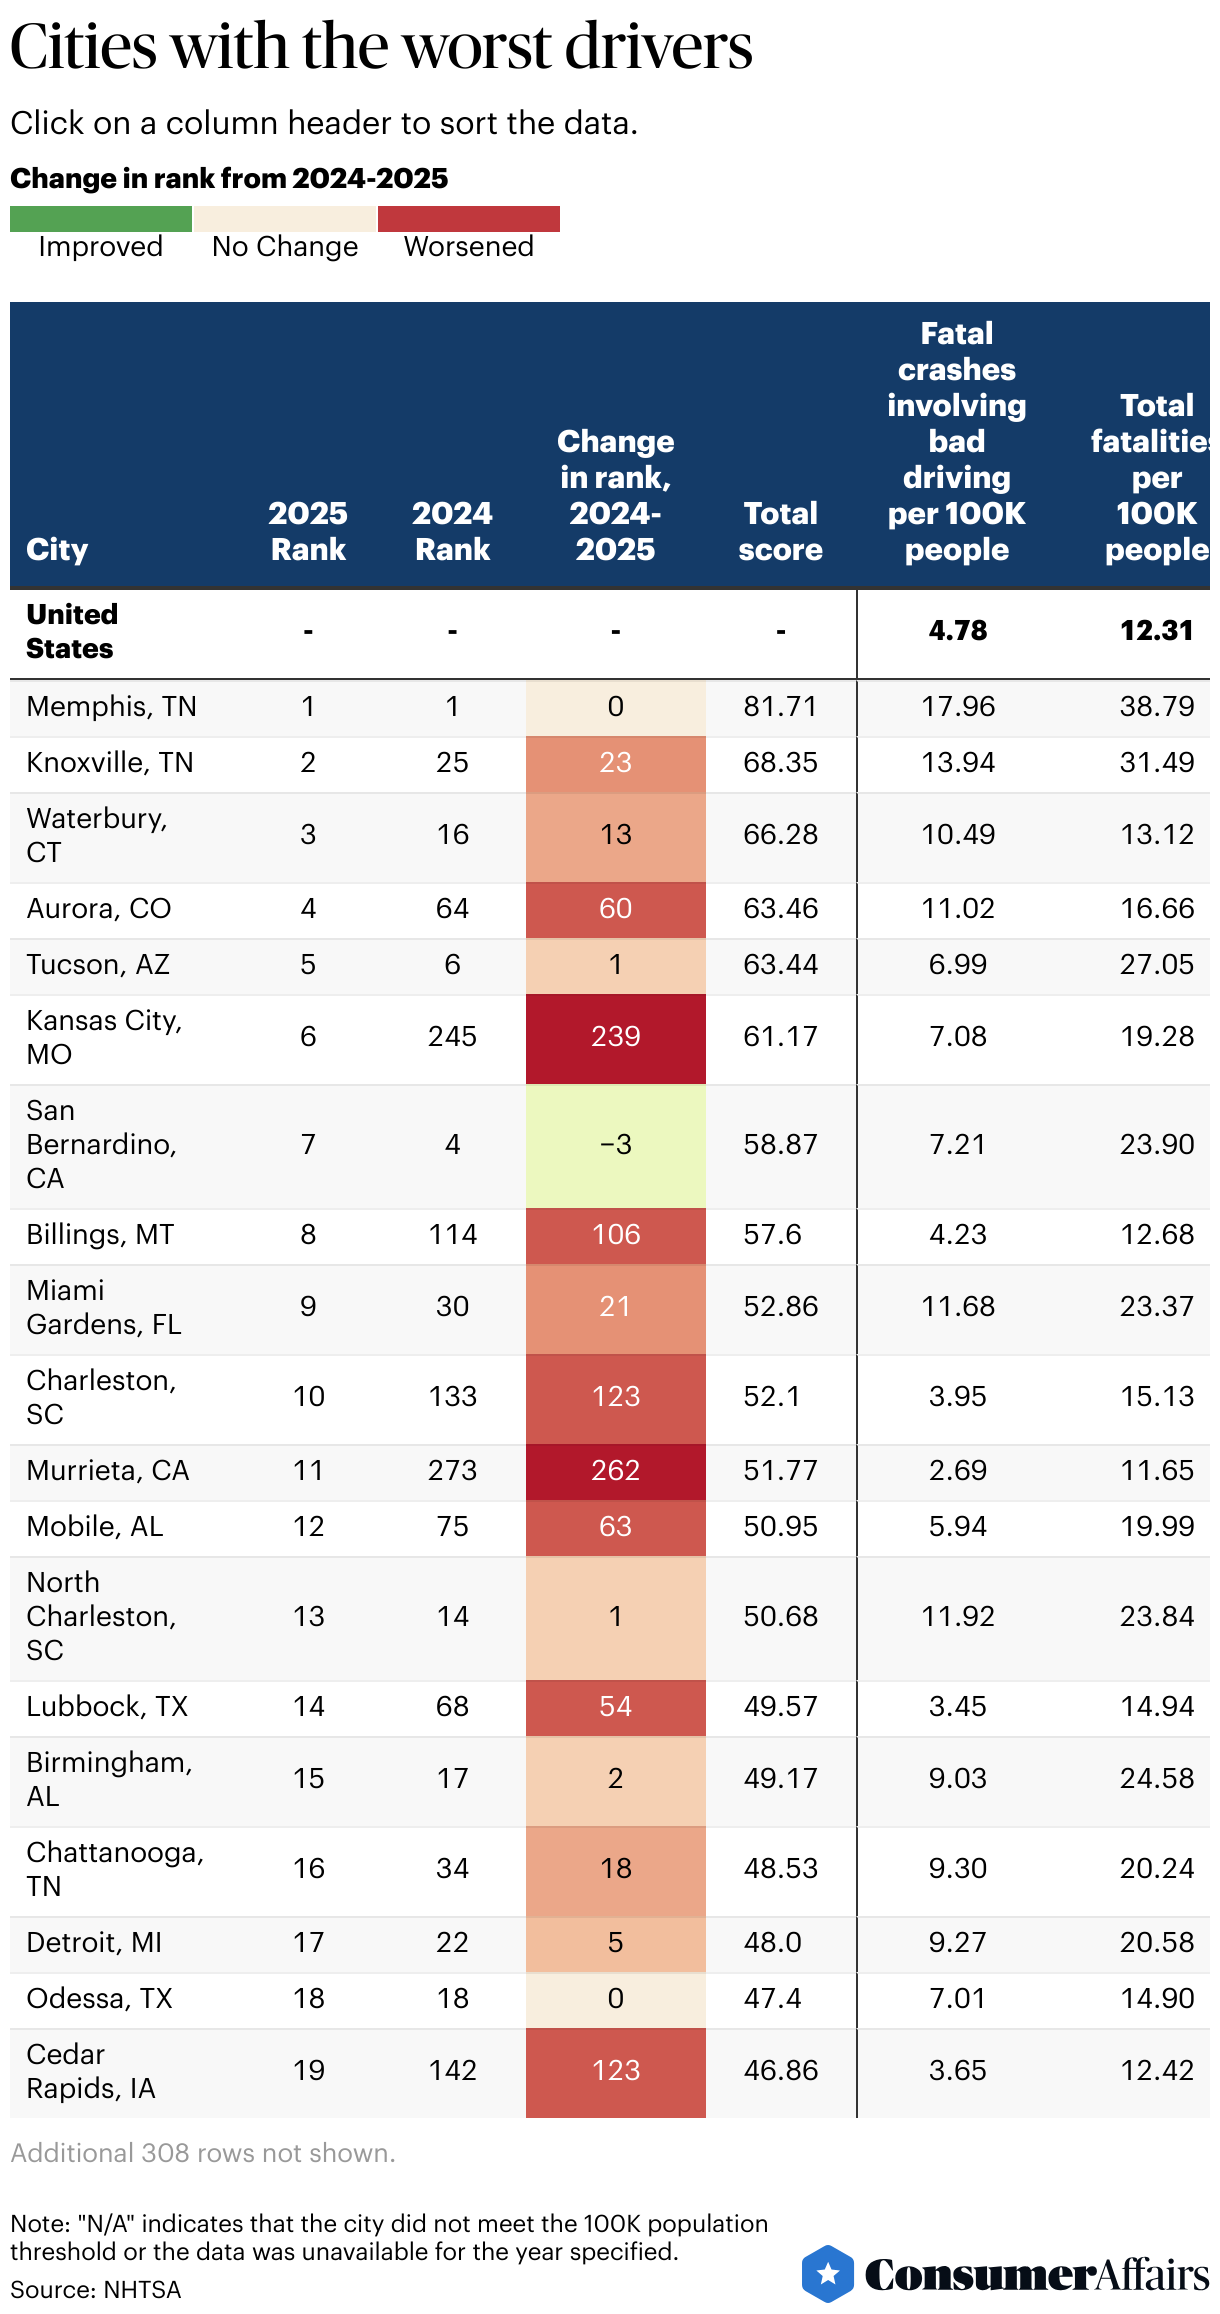
Memphis, Tennessee, has the worst drivers in the nation for the third year in a row. The rate of fatal crashes involving bad driving is nearly four times the national rate.
Jump to insightSouthern and Western cities dominate the list for worst drivers, with four cities from each region ranking in the top 10.
Jump to insightWaterbury, Connecticut, has the highest rate of DUI-related traffic fatalities, at over four times the national rate.
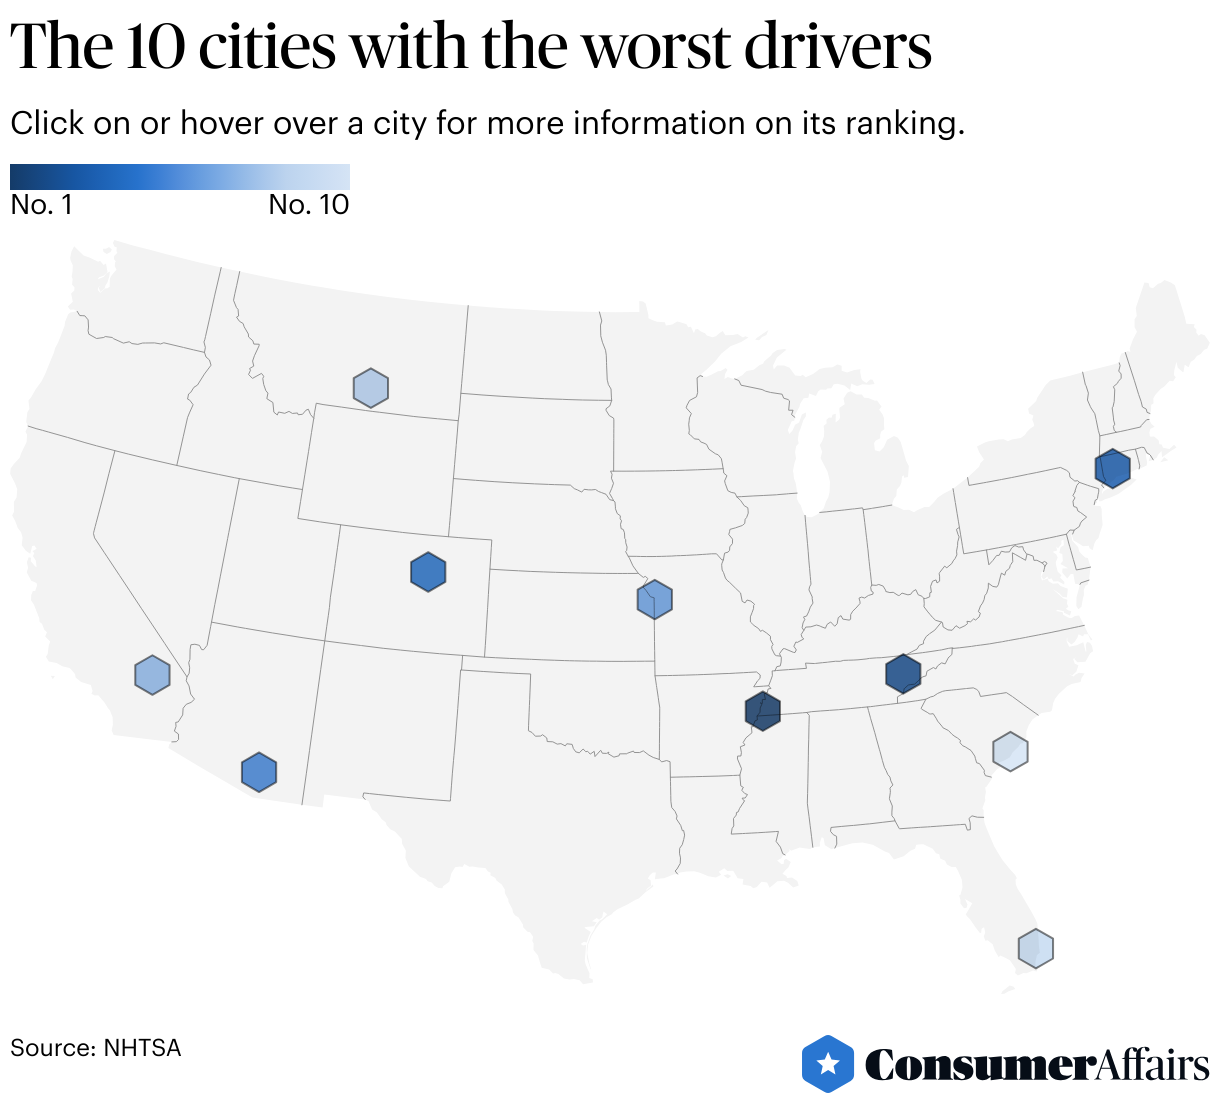
Jump to insightWhich cities have the worst drivers in the U.S.?
Note the prevalence of Southern and Western cities on the map below — eight of the top 10 cities are located in the South or West. And this trend isn’t confined to just the highest ranks: Southern and Western cities actually make up 40 of the worst 50 metros for dangerous driving.
But why are some cities so much deadlier for motorists than others?
“The experience in any city results from a combination of demographic factors, roadway design and layout, policies, and enforcement of traffic laws,” said Joe Young of the Insurance Institute for Highway Safety (IIHS). The unique footprint of a city, including whether it’s sprawling or densely concentrated, influences the types of roads people drive on — and with whom drivers are sharing those roads, he explained.
Young emphasized that road safety is a function of more than just motorists. “Dangerous roads aren't just a result of the people driving them, but also policies and designs that allow for or encourage those behaviors,” Young said. “Issues with speeding, for example, may point to roadway designs or speed limits that encourage higher speeds, or lack of enforcement of the speed limits that do exist.”
State-level policy decisions can play a role. “Driver licensing policies differ across the country and can affect crash rates for younger drivers. Some states may also have policies in place that make it more difficult for cities to address problematic areas,” Young said. One example is statewide bans against automated enforcement technologies such as speed and red light cameras, which the Governors Highway Safety Association calls “powerful tools to reduce crashes.” According to the National Conference of State Legislatures, 10 states ban one or both types of cameras, including Montana and South Carolina, which have cities ranked in the top 10.
Read on for a closer look at the 10 cities with the most dangerous drivers:
1. Memphis, Tennessee
For the third year in a row, we found that Memphis, Tennessee, has the worst drivers in the nation. The Home of the Blues has the highest rate of traffic fatalities, with 38.79 deaths per 100,000 residents. That’s more than triple the rate nationwide.
Memphis also has the most fatal crashes involving “bad driving” behaviors. In the latest available data year, the city reported 113 deaths related to bad driving, the most of all 327 cities we compared. That’s a rate of 17.96 fatal crashes involving bad driving per 100,000 Memphis residents — nearly four times the national rate.
Additionally, Memphis has the highest rate of alcohol-related traffic deaths, with 9.22 fatalities per 100,000 residents.
And Memphis isn’t just dangerous for drivers — it’s also one of the most dangerous cities for pedestrians, ranking second worst in the nation. In Memphis, nearly a quarter of all car crash-related deaths are pedestrians.
It’s worth noting that Memphis has ranked No. 1 every year we’ve done this analysis (since 2023). However, the city is taking steps to turn the tide. In December 2024, the city of Memphis pledged to create a strategic “safety action plan” in an effort to reduce or eliminate roadway deaths and serious injuries, with public meetings beginning in early 2025.
2. Knoxville, Tennessee
Knoxville has the second-highest rate of fatal crashes involving bad driving, at 13.94 per 100,000 residents, or nearly three times the national rate. Knoxville also ranks particularly high for speeding-related fatalities, with 9.29 deaths per 100,000 residents, the fifth highest in the nation.
Interestingly, Knoxville has seesawed in the rankings over the past three years. The city ranked 12th worst in 2023 and fell to 25th worst in 2024 before rocketing back up to second worst in 2025.
Despite climbing in the rankings year over year, Knoxville is taking steps to make its roads safer. In 2021, Knoxville’s City Council voted unanimously to support a goal of eliminating traffic deaths and serious injuries on city roads — known as Vision Zero — by 2040. Since then, some strategic steps have been completed: In 2023, the city mapped its high injury network (HIN) to identify the areas where a disproportionate number of fatal crashes occur. And by 2024, the city hired a full-time coordinator to lead the efforts and secured $17.8 million in federal funding from the U.S. Department of Transportation’s Safe Streets and Roads for All grant program.
3. Waterbury, Connecticut
Waterbury, Connecticut, ranks third worst overall and is the highest-ranked metro in the Northeast. In fact, the next Northeastern city doesn’t appear for more than 40 ranks: Nearby Hartford, Connecticut, ranks 44th worst, followed by New Haven, Connecticut, at 125th.
Waterbury has the highest rate in the country of traffic fatalities that involve driving under the influence, with 7.87 such fatalities per 100,000 residents — more than four times the U.S. rate. Waterbury also ranks in the top 10 cities for deadly crashes involving bad driving, with a rate of 10.49 per 100,000 residents, ninth highest in the country.
Concerns over aggressive driving aren’t limited to Waterbury, either. In October 2025, a new state law takes effect that establishes harsher penalties for reckless drivers exceeding 100 mph, including a fine of $200 to $600 and/or 30 days in prison.
4. Aurora, Colorado
This year marks Aurora’s first appearance in the 10 worst cities for driving. In our past two years of analysis, Aurora landed significantly lower in the overall rankings (53rd in 2023 and 64th in 2024, respectively).
One factor driving this leap is a particularly high rate of fatal crashes involving bad driving. Aurora has 11.02 fatal crashes related to bad driving behaviors per 100,000 residents. That’s the eighth-highest rate of the cities we compared.
However, Aurora ranks even worse for fatal crash rates involving alcohol use. The city ranks seventh worst for the rate of fatalities related to driving under the influence (5.38 deaths per 100,000 people) and second worst for the rate of fatalities involving positive blood alcohol content (BAC) readings (7.43 fatalities per 100,000 residents).
In Colorado at large, dangerous driving isn’t limited to Aurora: Our latest analysis found the state ranks third worst for road rage.
5. Tucson, Arizona
Tucson climbed up one place from last year’s rank to land at fifth worst for dangerous driving in 2025. The city’s high rank is driven by two key factors in our analysis: the overall rates of traffic fatalities (27.05 per 100,000 residents) and fatalities involving speeding (9.75 per 100,000 people). Tucson ranks fourth worst in both metrics.
It’s worth noting that Tucson isn’t just dangerous for drivers — it’s unsafe for cyclists, too. The city is the fifth most dangerous for cyclists, with cyclist fatalities occurring at a rate more than four times the national number. Tucson’s pedestrians don’t fare much better — the city ranks seventh worst for pedestrian safety, with 6.44 pedestrian fatalities per 100,000 residents (a rate almost triple the U.S. rate).
6. Kansas City, Missouri
Kansas City ranks sixth worst for dangerous drivers overall, and sixth for the rate of traffic fatalities involving positive BAC readings (6.49 per 100,000 residents). The city ranks even higher — second worst — for deaths involving speeding, with a rate of 10.63 per 100,000 residents. That’s triple the nationwide rate.
Interestingly, Kansas City is also among the cities with the least traffic. While less traffic may sound like good news to Kansas City’s commuters, lower traffic doesn’t necessarily mean fewer accidents. “Traffic volume is an inverse risk factor for road deaths at the local level, likely the result of lower speeds on congested roads,” Leon Robertson, a sociologist, epidemiologist and adjunct professor of environmental health at Yale University, wrote in a recent study.
7. San Bernardino, California
San Bernardino ranks seventh worst overall, with three key metrics that land in the top 10. The city has the fifth-highest rate of fatalities related to driving under the influence (5.86 per 100,000 residents), the seventh-highest rate of fatalities related to speeding (9.02 per 100,000 residents) and the ninth-highest rate of total crash-related fatalities.
Notably, among the 20 cities with the most dangerous drivers, San Bernardino is the only one that improved in rank from 2024 to 2025. (In our analysis last year, it was ranked fourth worst.) The overall rate of traffic fatalities in San Bernardino did fall slightly year over year, from just under 26 deaths per 100,000 residents last year to just below 24 deaths per 100,000 residents.
While this small bright spot hopefully indicates a turning tide, San Bernardino — and the whole state of California — still have a long way to go to make roads safer. Recent investigative reporting by the nonprofit news organization CalMatters found that statewide, the California Department of Motor Vehicles often allows drivers with dangerous records, including convictions for misdemeanor vehicular manslaughter, to keep their licenses.
8. Billings, Montana
While Billings ranks lower (89th worst) for the total rate of traffic fatalities, the city ranks eighth worst overall because of high rates of fatal crashes involving alcohol and speeding. Billings has the ninth-highest rate of deaths related to driving under the influence (5.07 per 100,000 residents), the fifth-highest rate of traffic fatalities involving positive BAC readings (6.76 per 100,000 residents) and the third-highest rate of fatalities involving speeding (10.14 per 100,000 residents, almost triple the national rate).
Dangerous driving is also a significant issue for Montana’s younger road users: Our 2025 analysis found that the state has the worst teen drivers.
While our analysis didn’t evaluate traffic fatalities involving distracted driving, it’s worth noting that Montana is the only state that hasn’t yet banned texting while driving. There aren’t any state laws that ban other types of cellphone use, either, even for new drivers.
9. Miami Gardens, Florida
This northern Miami suburb is the least populous metro in the 10 worst-ranked cities, so some of the raw numbers are lower than in other cities. But Miami Gardens ranks fifth worst for deadly crashes involving bad driving, with a rate of 11.68 per 100,000 residents. (Compare that with the nationwide rate of 4.78 crashes per 100,000 people.)
The city also ranks high for fatalities involving speeding: A rate of nearly nine fatalities per 100,000 residents places Miami Gardens eighth worst in that metric.
10. Charleston, South Carolina
Charleston is another city that rose significantly in the rankings from last year: The city climbed from 133rd worst in 2024 to 10th worst in 2025.
The jump in rankings can be attributed, at least in part, to high rates of fatalities that involved positive BAC readings and speeding. Charleston has the fourth-highest rate of deaths involving positive BAC readings (7.24 per 100,000 residents) and the 11th-highest rate of deaths involving speeding (8.55 per 100,000 people).
According to the South Carolina Department of Public Safety, distracted or inattentive driving contributes to more than 20,000 crashes each year in the state. However, new legislation that penalizes distracted driving may soon begin to curb the behavior. On Sept. 1, 2025, the state’s new Hands-Free and Distracted Driving Act goes into effect, which makes it illegal to hold a cellphone while driving.
Have driving behaviors in America's cities improved over the past year?
Unfortunately, there’s not one simple answer to whether driving behaviors have improved.
Looking at the 25 worst cities, we found that just two improved in the rankings since last year: San Bernardino (improved from fourth worst in 2024 to seventh worst in 2025) and Pueblo, Colorado (improved from 11th worst to 24th worst). Aside from Memphis, which finished worst both years, one city in the top 25 held steady: Odessa, Texas, at 18th worst.
However, zooming out to nationwide, longer-term trends, the data indicates some recent progress.
“On a national level, the pandemic was very bad for traffic safety,” said Young of the IIHS. “Several dangerous behaviors, including speeding, failing to wear a seat belt and impaired driving, increased significantly. This was partially due to shifts in which drivers were out on the road, but also reduced enforcement.”
Indeed, traffic fatalities spiked in 2021 with a staggering 42,939 fatalities, but they have begun to fall in the years since. From 2022 to 2023, traffic fatalities decreased by 4.3%, and from 2023 to 2024, they decreased by an estimated 3.8%.
“Only recently have we started to see fatality numbers start to turn around,” Young said. “However, there's a lot of work to be done.”
To explore the full dataset for all 327 cities we compared, check out the table below.
Tips for protecting yourself against bad drivers
Defensive driving involves maintaining a safe speed, keeping an appropriate following distance from other vehicles and staying vigilant for potential risks. All these behaviors give you more time to anticipate or notice other drivers’ mistakes and take action before it’s too late.
Brush up on some additional steps you can take to protect yourself on the road and help make it safer for other motorists and road users:
- Approach intersections carefully. In the U.S., roughly 1 in 4 traffic fatalities (and about half of all traffic injuries) are attributed to intersections every year. Whether it’s a four-way stop on a surface street or more complex, multilane intersections, scan the landscape for oncoming drivers and remember that the right of way is given, not taken.
- Move over for flashing lights. All 50 states have “move over” laws to make space for emergency vehicles with flashing lights. In 19 states and Washington, D.C., the laws also apply to any other vehicles with flashing or hazard lights, including construction, utility and highway maintenance vehicles.
- Watch for work zones. Work zones are especially high-fatality driving areas. Over the 10-year period ending in 2023, work zone fatal crashes increased from 608 to 818. Be extra attentive and cautious when navigating these areas, and observe the posted speed limits, even if it seems like other drivers aren’t.
- Be diligent with the basics. “No matter where someone lives, the best things they can do to keep themself safe out on the road is to buckle up on every trip, avoid impaired or distracted driving and watch their speed,” said Young of the IIHS. “If everyone did those things, our roads would be significantly safer.”
Methodology
To determine cities with the worst drivers, the ConsumerAffairs Research Team analyzed the most recently reported crash data from the National Highway Transportation Safety Administration (NHTSA) Fatality Analysis Reporting System (FARS).
We looked at five crash factors:
- The number of fatalities related to crashes per 100,000 people
- The number of fatal crashes related to bad driving per 100,000 people
- The number of fatalities involving positive BAC readings per 100,000 people
- The number of fatalities involving driving under the influence per 100,000 people
- The number of fatalities involving speeding per 100,000 people
Each city was scored out of 20 for each factor, with the city with the highest rate of crashes or deaths given a maximum score and others getting relative scores. We then added the individual scores together to get a “crash score,” which has a maximum of 100 points.
Examples of “bad driving” included:
- Aggressive driving
- Careless driving
- Driving the wrong way on a one-way traffic way
- Failure to yield the right of way
- Following improperly
- Improper or erratic lane changing
- Making an improper turn
- Operating the vehicle in an erratic, reckless or negligent manner
- Operator inexperience
- Passing where prohibited
We only included cities with populations of 100,000 or greater.
Reference policy
We love it when people share our findings! If you do, please link back to our original article to credit our research.
Questions?
For questions about the data or if you'd like to set up an interview, please contact rsowell@consumeraffairs.com.
Article Sources
ConsumerAffairs writers primarily rely on government data, industry experts and original research from other reputable publications to inform their work. Specific sources for this article include:
- National Highway Traffic Safety Administration, “NHTSA File Downloads.” Accessed Aug. 12, 2025.
- National Highway Traffic Safety Administration, “NHTSA Estimates 39,345 Traffic Fatalities in 2024.” Accessed Aug. 12, 2025.
- Governors Highway Safety Association, “Speed & Red Light Cameras.” Accessed Aug. 12, 2025.
- National Conference of State Legislatures, “Traffic Safety Review: State Speed and Red-Light Camera Laws and Programs.” Accessed Aug. 12, 2025.
- WATN-TV, “City of Memphis putting together Safety Action Plan to reduce car accidents and roadway deaths.”Accessed Aug. 12, 2025.
- Memphis Safety Action Plan, “About.” Accessed Aug. 12, 2025.
- WATN-TV, “Memphis launches plan to improve road safety, seeks public input.” Accessed Aug. 12, 2025.
- City of Knoxville, “Vision Zero.” Accessed Aug. 12, 2025.
- Vision Zero: Safer Streets for Knoxville, “Vision Zero 2024 Yearly Report.” Accessed Aug. 12, 2025.
- Connecticut General Assembly, “Substitute for Raised H.B. No. 7132.” Accessed Aug. 12, 2025.
- ScienceDirect, “Daily motor vehicle traffic volume and other risk factors associated with road deaths in U.S. counties.” Accessed Aug. 12, 2025.
- CalMatters, “7 takeaways: How the DMV allows dangerous drivers to stay on the road.” Accessed Aug. 12, 2025.
- Governors Highway Safety Association, “Distracted Driving.” Accessed Aug. 12, 2025.
- South Carolina Department of Public Safety, “Distracted Driving.” Accessed Aug. 12, 2025.
- Bureau of Transportation Statistics, “Overview of Motor Vehicle Traffic Crashes in 2021.” Accessed Aug. 12, 2025.
- National Highway Traffic Safety Administration, “Overview of Motor Vehicle Traffic Crashes in 2023.” Accessed Aug. 12, 2025.
- Texas Department of Insurance, “Defensive Driving Take 5.” Accessed Aug. 12, 2025.
- Federal Highway Administration, “About Intersection Safety.” Accessed Aug. 12, 2025.
- National Highway Traffic Safety Administration, “10 Safe Driving Tips for 2025.” Accessed Aug. 12, 2025.
- National Highway Traffic Safety Administration, “Move Over: It's the Law.” Accessed Aug. 12, 2025.
- Work Zone Safety Information Clearinghouse, “Work Zone Traffic Crash Trends and Statistics.” Accessed Aug. 12, 2025.
Figures