How much is the car insurance industry worth? 2026
+1 more

Auto insurance is an agreement where the insurer covers a policyholder’s financial losses from accidents or theft in return for a premium. Premiums are determined through underwriting, where insurers evaluate an applicant's risk using personal information and past claims data, and rating factors, which assess the likelihood of future claims.
In most states, carrying a minimum level of liability insurance is mandatory, covering the other driver's repair and medical expenses if you're at fault in an accident. However, the majority of insured drivers choose extra protection, despite the cost of car insurance. Approximately 79% of drivers add comprehensive coverage, and 75% opt for collision coverage, often due to more extensive protection needs or requirements from loan or lease agreements.
The auto insurance industry's market size in the U.S., based on revenue, reached $353.3 billion in 2023.
Jump to insightAccording to the latest data from the National Association of Insurance Commissioners, the average amount consumers spent on auto insurance in 2021 was $1,062.
Jump to insightIndustry experts estimate average car insurance costs to be about $2,000 in 2023, though official data won’t be available until 2025.
Jump to insightIn 2021, New York, Louisiana and Florida were the top three states where policyholders spent the most on auto insurance. On the other hand, North Dakota, Maine and Iowa were the least expensive states for auto insurance.
Jump to insightTexas, California and Florida rank as the top three states in terms of number of employed auto insurance appraisers.
Jump to insightCar insurance industry statistics
The National Association of Insurance Commissioners (NAIC) calculates the average expenditure per insured vehicle in the U.S., which represents the estimated amount that consumers in a state spend on auto insurance. This calculation assumes that all insured vehicles have liability coverage but not necessarily collision or comprehensive coverage.
National average expenditure 2017-2021
| Year | Average expenditure | Percentage change from previous year |
|---|---|---|
| 2021 | $1,061.67 | 1.5% |
| 2020 | $1,046.38 | -2.4% |
| 2019 | 1,071.74 | 1.3% |
| 2018 | $1,058.10 | 4.9% |
| 2017 | $1,008.53 | - |
To assess the affordability of personal auto insurance, the Insurance Research Council (IRC) calculates the ratio of the average auto insurance expenditures to the median household income. This ratio represents the percentage of household income dedicated to auto insurance payments. According to a 2022 IRC study, the five least affordable states for personal auto insurance included the following:
- Louisiana (3.0%)
- Florida (2.4%)
- Michigan (2.3%)
- Georgia (2.2%)
- Mississippi (2.2%)
On the other hand, the five most affordable states for personal auto insurance were as follows:
- Hawaii (1.0%)
- New Hampshire (1.0%)
- North Dakota (1.0%)
- Maine (1.1%)
- Vermont (1.1%)
Market size
In 2023, the auto insurance industry's market size in the U.S., based on total revenue, reached $353.3 billion. The industry exhibits moderate market share concentration, with the leading four companies accounting for 40% to 70% of the industry's revenue.
Automotive insurance industry employment
The latest data from the U.S. Bureau of Labor Statistics (BLS) as of May 2022 provides employment estimates for insurance appraisers of auto damage, according to the BLS classifications. Notable national and state specifics include the following:
- Nationally, the industry employed 11,430 insurance appraisers (this estimate does not include self-employed workers).
- The top three states with the highest numbers of employed auto insurance appraisers are Texas, California and Florida.
- At the national level, the mean hourly wage was $34.42, while the mean annual wage was approximately $71,600.
- The states with the highest mean annual wages for auto insurance appraisers include New York, New Hampshire, Massachusetts, Hawaii and Connecticut, ranging from about $90,800 (New York) to $83,200 (Connecticut).
Auto insurance industry by state
The NAIC notes that car insurance rates are mainly determined by the cost insurers incur from paying claims. Certain states’ characteristics play a role in determining insurer loss costs and can influence policy prices. Therefore, consideration should be exercised when comparing auto insurance prices between states.
As previously noted, the average expenditure is the estimated amount that consumers typically spend on auto insurance. The NAIC calculates average expenditure assuming all vehicles have liability coverage, but not necessarily collision or comprehensive coverage.
The top five states with the most expensive auto insurance in terms of average expenditure are New York, Louisiana, Florida, Rhode Island and New Jersey. The five least expensive states include North Dakota, Maine, Iowa, Idaho and Wisconsin.
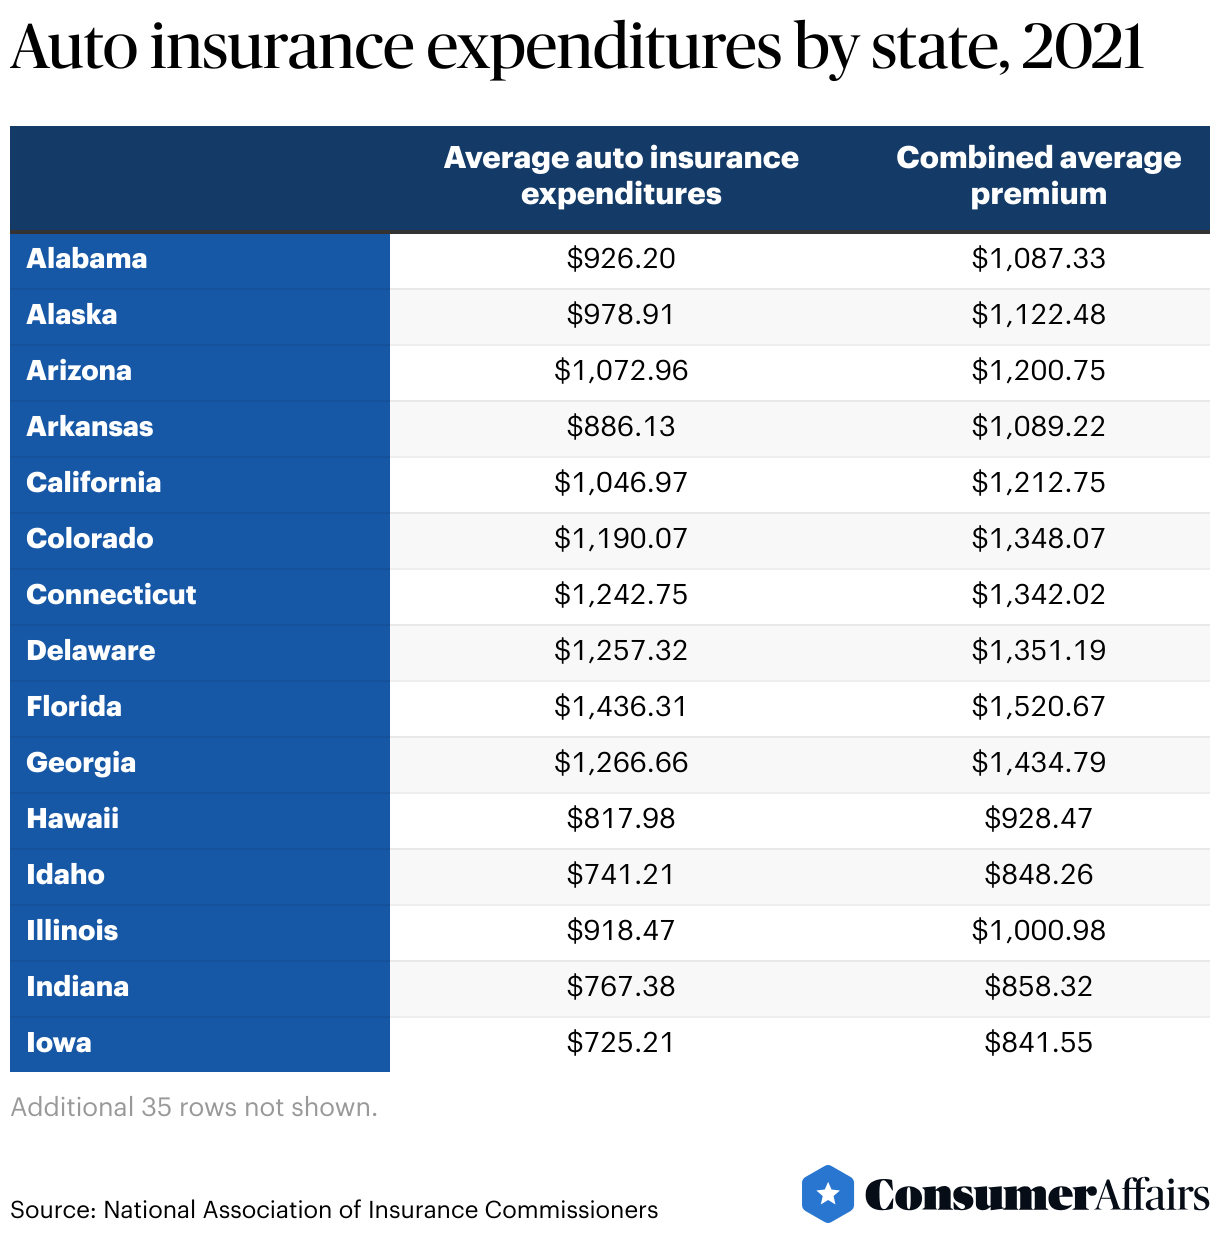
On the other hand, the combined average state premium for each insured vehicle is determined by adding together the average premiums for liability, comprehensive and collision coverages. Based on the latest estimates by the NAIC, the top five most expensive states in terms of combined average premium policies include Louisiana, New York, Rhode Island, Florida and New Jersey. The least expensive states include Maine, North Dakota, Wisconsin, Iowa and Vermont.
Could electric cars affect the auto insurance industry?
In 2023, electric vehicle (EV) sales in the U.S. experienced a 50% increase over the previous year. More than 1.4 million EVs were sold, bringing the total number of EVs in the U.S. to more than 4 million. Automakers are transitioning from internal combustion engines to electric vehicle production, driven by increasing consumer demand and government incentives. This shift aligns with the Biden-Harris administration's goal for EVs to constitute at least 50% of new car sales by 2030.
Currently, EV premiums per vehicle are higher than those for internal combustion engine (ICE) vehicles, as repair and replacement costs are higher for EVs, and there is a shortage of experts with specialized knowledge. However, according to a 2023 EY report, as the number of EVs increases, the cost gap between EV and ICE insurance premiums is expected to narrow. The report also points out that by 2035, direct premiums written for EV policies are projected to reach about $84 billion. This will represent a 20% decrease in ICE vehicles' contribution to the personal auto premium pool.
Future projections
According to an EY-Parthenon study, the rise of EVs, autonomous vehicles (AVs) and shared-mobility services, along with an increase in telematics data on drivers’ behaviors and evolving consumer expectations will reshape the auto insurance industry. These changes are set to redefine how auto insurance is distributed, priced and underwritten, posing challenges to the profitability of traditional insurance models. Furthermore, these shifts will open opportunities for new entrants, such as vehicle manufacturers, to compete by using telematics data and their direct relationships with consumers to generate new revenue streams.
Mordor Intelligence predicts that the auto insurance market in the U.S., in terms of direct written premiums, will grow from $360.7 billion in 2024 to $453.8 billion by 2029. This represents a compound annual growth rate of 4.7% during this period.
FAQ
How many uninsured drivers are in the U.S.?
The Insurance Research Council estimates that in 2022, 14% of drivers in the U.S. did not have auto insurance.
Which states have the most expensive auto insurance?
Policyholders in New York, Louisiana and Florida incurred the highest auto insurance costs (based on 2021 data).
How much does an auto insurance agent earn?
According to the U.S. Bureau of Labor Statistics, in 2022, the average annual wage for an auto insurance agent was nearly $71,600. The average hourly rate was $34.42.
What factors will affect the auto insurance industry in the future?
Several factors will likely reshape the auto insurance industry, including evolving consumer expectations and the rise of electric and autonomous vehicles, shared-mobility services and telematics data on drivers’ behaviors.
Article sources
ConsumerAffairs writers primarily rely on government data, industry experts, and original research from other reputable publications to inform their work. Specific sources for this article include:
- Insurance Information Institute, “What is auto insurance?” Accessed Feb. 12, 2024.
- National Association of Insurance Commissioners, “Auto insurance.” Accessed Feb. 12, 2024.
- IBISWorld, “Automobile Insurance in the US - Market Size (2004–2029).” Accessed Feb. 14, 2024.
- National Association of Insurance Commissioners, “2021 Auto Insurance Database Average Premium Supplement.” Accessed Feb. 13, 2024.
- U.S. Bureau of Labor Statistics, “Occupational Employment and Wage Statistics.” Accessed Feb. 13, 2024.
- Insurance Research Council, “States Variations in Auto Insurance Affordability.” Accessed Feb. 14, 2024.
- IBISWorld, “Automobile Insurance in the US - Market Size, Industry Analysis, Trends and Forecasts (2024-2029).” Accessed Feb. 14, 2024.
- U.S. Department of Energy, “Statement by U.S. Energy Secretary Jennifer M. Granholm on 2023 EV Sales.” Accessed Feb. 14, 2024.
- McKinsey & Company, “Connected revolution: The future of US auto insurance.” Accessed Feb. 14, 2024.
- The White House, “Fact Sheet: Biden-Harris Administration Announces New Standards and Major Progress for a Made-in-America National Network of Electric Vehicle Chargers.” Accessed Feb. 14, 2024.
- EY, “How auto insurers can grow as a decade of disruption approaches.” Accessed Feb. 13, 2024.
- Mordor Intelligence, “United States Motor Insurance Market Size & Share Analysis - Growth Trends & Forecasts (2024 - 2029).” Accessed Feb. 14, 2024.
- Insurance Research Council, “14 Percent of U.S. Drivers Were Uninsured in 2022, IRC Estimates.” Accessed Feb. 14, 2024.
Figures