Housing market trends 2026
+1 more

The U.S. housing market faces a significant supply shortage and underbuilding problem. This scarcity has driven a decline in housing affordability, causing prices for both homeownership and rental properties to increase over recent decades, even when accounting for inflation and income adjustments. Without efforts to boost supply through policy changes, workforce development, and streamlining construction, the affordability crisis will likely worsen, potentially shutting more Americans out of homeownership and forcing renters to dedicate larger portions of income to housing.
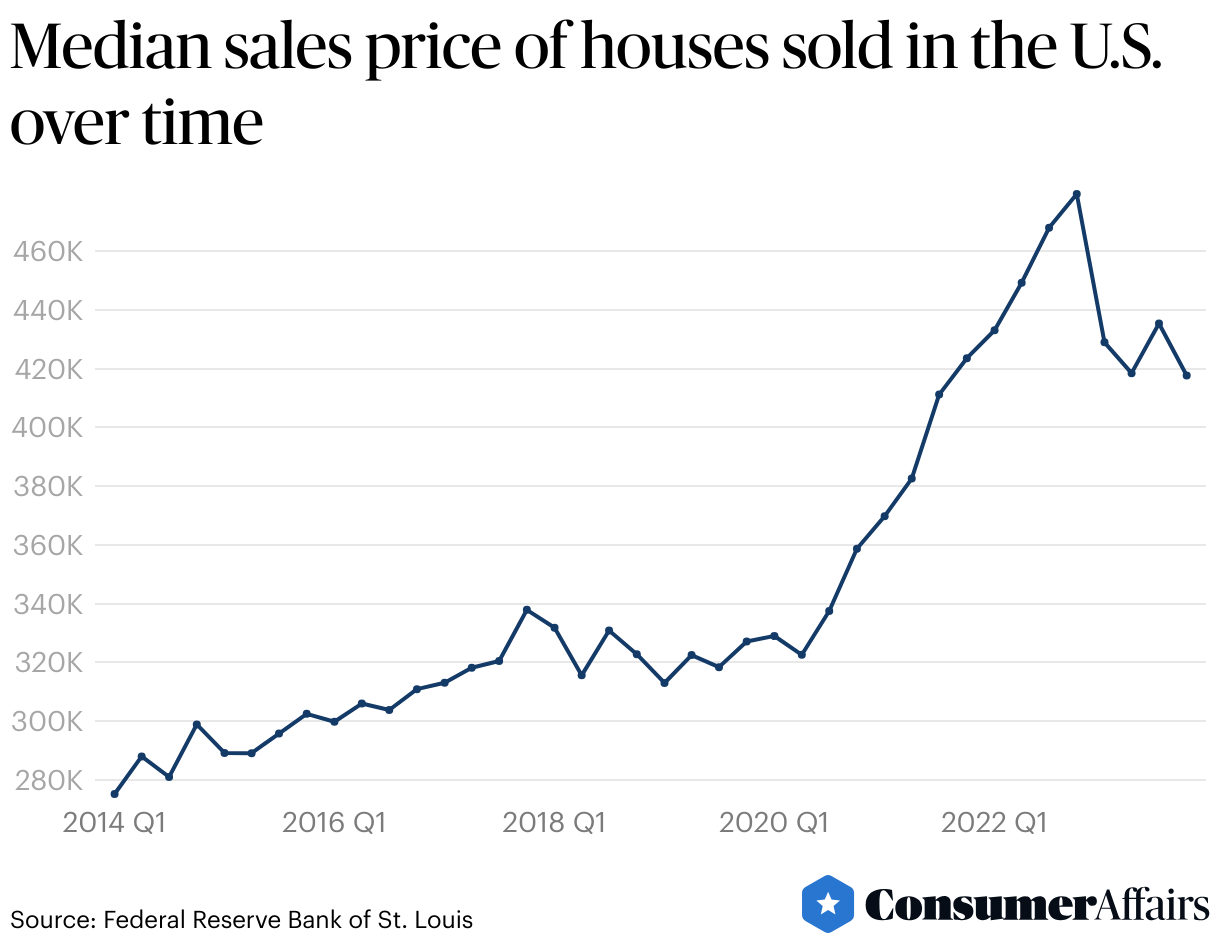
Over the past decade, there has been a noticeable increase in the median price of homes sold in the U.S., with a significant surge in home values during the pandemic.
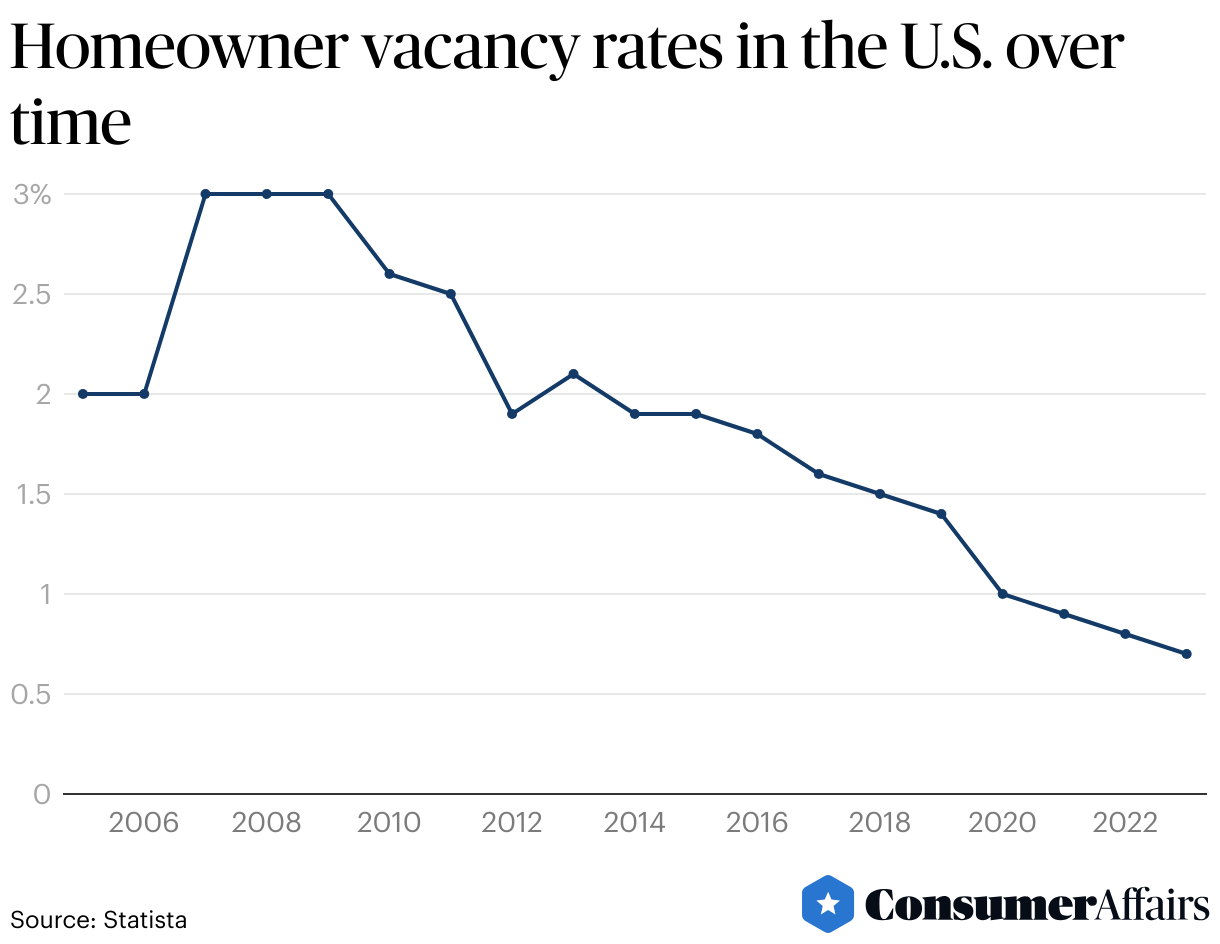
Jump to insightBetween 2005 and 2023, the homeowner vacancy rate in the U.S. reached its highest point at 2.8% in 2008 and fell to its lowest at 0.7% in 2023.
Jump to insightOver the past 40 years, the housing supply in the U.S. has not kept up with population growth.
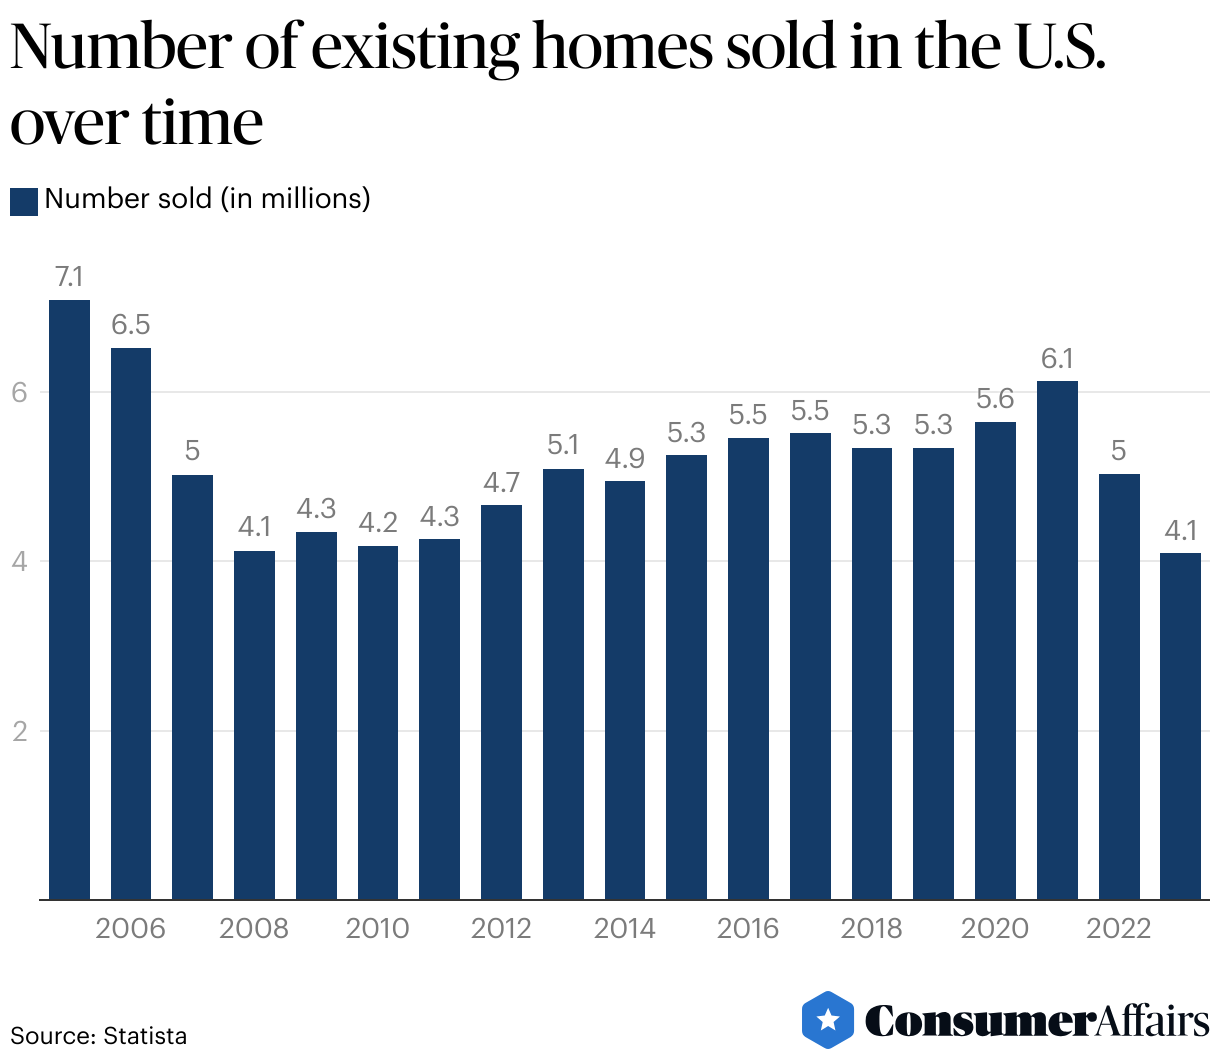
Jump to insightBetween 2005 and 2023, the peak year for home sales in the U.S. was 2005, with approximately 7 million homes sold. In contrast, 2023 recorded the lowest sales during this period, with around 4 million homes sold.
Jump to insightThe average length of homeownership in the U.S. is estimated at 12 years, based on the data from 2005 to 2022.
Jump to insightHousing pricing trends
Long-standing factors such as local zoning restrictions and a lack of affordable or public housing have continuously impacted the U.S. housing supply. The pandemic exacerbated these issues, causing the prices of essential commodities to spike and raising home construction costs.
Additionally, there was a significant shift in migration patterns, with more people moving from city centers to less populated areas. Furthermore, lower mortgage rates made borrowing cheaper, further fueling the demand for new homes. This trend can be observed in the sharp increase in median home sale prices that started in the second quarter of 2020, as shown in the table below.
That said, the pandemic is not responsible for originating the underlying supply constraints in the housing market, which reduced the availability of rental and for-sale homes. Instead, the pandemic highlighted long-standing constraints that have impacted households across income levels for decades. In fact, over the past 40 years, the housing supply has not kept pace with population growth. Additionally, housing costs now consume an increasingly large portion of household budgets in the U.S.
Average length of home ownership
According to a Redfin analysis of county records for the period between 2005 and 2022, the average U.S. homeowner has lived in their home for approximately 12.3 years. Homeowner tenure hit a high in 2020, averaging 13.4 years. In contrast, the shortest tenure was in 2005, with a median duration of 6.5 years.
The trend in the average duration of homeownership in the U.S. has been increasing due to several factors, including:
- Long homeowner tenure is primarily influenced by the aging population. Currently, about 17% of the U.S. population is 65 or older, and the proportion is expected to rise in the future. Over one-third of homeowners aged 65 and older have owned their home for at least 33 years.
- In addition, older Americans increasingly prefer to age in place, with nearly 90% of those between 50 and 80 years old expressing the desire of staying in their homes as they grow older.
- There is a significant shortage of homes for sale, with the supply near historic lows and very few new listings entering the market.
- Affordability issues persist as home prices remain substantially higher than pre-pandemic levels. Coupled with increased mortgage rates, typical monthly mortgage payments are approaching record highs, deterring many people from moving.
Houses sold per year
From 2005 to 2023, the highest number of homes sold in the U.S. in a single year was approximately 7 million in 2005, marking it as the peak year for home sales during this period. Conversely, 2023 saw the lowest number of transactions, with about 4 million homes sold.
In recent years, surging home prices have rendered homeownership increasingly out of reach for the average buyer. A survey of owners and renters pinpointed steep home prices and adverse economic conditions as the main obstacles to buying a home. To qualify for a mortgage, prospective buyers need to have a substantial deposit, uphold a strong credit score and demonstrate a stable, adequate income.
In particular, 2022 witnessed the sharpest rise in mortgage rates ever recorded, which greatly increased the overall cost of owning a home. Consequently, only 15% of U.S. renters were in a financial position to afford homeownership.
In addition, working families are struggling to compete with investors for the limited number of affordable homes available for sale.
Homeowner vacancy rates by year
Homeowner vacancy rates represent the proportion of owner-occupied housing units that are vacant and available for sale. Since the housing market crash and financial crisis of 2007-2009, vacancy rates in owner-occupied markets have consistently declined. This trend accelerated during the COVID-19 pandemic, leading to multi-decade low 2023.
As seen in the table below, over the period from 2005 to 2023, the homeowner vacancy rate peaked in 2008 at 2.8% and reached its lowest point in 2023, at 0.7%.
FAQ
What factors have contributed to a decreasing housing supply in the U.S. in recent decades?
Factors include shifting demographics, restrictive zoning, land use policies, rising regulatory costs and increasing inflation that has driven up the costs of construction materials. In addition, policies implemented to counter rising inflation have led to higher mortgage rates.
Which year in the last decade recorded the lowest number of home sales in the U.S.?
The year with the fewest home sale transactions was 2023, during which approximately 4 million homes were sold.
Which demographic is primarily responsible for the trend of longer homeowner tenure in the U.S.?
Baby boomers are largely responsible for the trend toward extended homeowner tenure, with over one-third of those aged 65 and older having retained their homes for at least 33 years. In comparison, among millennial homeowners, half have owned their homes for three years or less.
Article sources
ConsumerAffairs writers primarily rely on government data, industry experts, and original research from other reputable publications to inform their work. Specific sources for this article include:
- Congressional Research Service, “U.S. Housing Supply: Recent Trends and Policy Considerations.” Accessed Apr. 22, 2024.
- Federal Reserve Bank of St. Louis, “Median Sales Price of Houses Sold for the United States.” Accessed Apr. 22, 2024.
- Statista, “Homeowner vacancy rates in the United States from 1990 to 2023.” Accessed Apr. 22, 2024.
- The White House: Biden Administration, “Alleviating Supply Constraints in the Housing Market.” Accessed Apr. 22, 2024.
- Statista, “Number of existing homes sold in the United States from 2005 to 2023, with a forecast until 2025.” Accessed Apr. 22, 2024.
- Redfin, “The Typical U.S. Home Changes Hands Every 12 Years, Down From 2020 Peak.” Accessed Apr. 22, 2024.
- The White House: Biden Administration, “Housing Prices and Inflation.” Accessed Apr. 22, 2024.
- The White House: Biden Administration, “Increasing the Supply of Affordable Housing: Economic Insights and Federal Policy Solutions.” Accessed Apr. 22, 2024.
- The White House: Biden Administration, “Fact Sheet: President Biden Announces Plan to Lower Housing Costs for Working Families.” Accessed Apr. 22, 2024.
- Statista, “Share of old age population (65 years and older) in the total U.S. population from 1950 to 2050.” Accessed Apr. 22, 2024.
- Institute for Healthcare Policy and Innovation, University of Michigan, “Older Adults’ Preparedness to Age in Place.” Accessed Apr. 22, 2024.
- Redfin, “Market Recovery Hampered by High Housing Costs, Low Supply in January.” Accessed Apr. 22, 2024.
- Redfin, “Housing Market Update: Sale Prices Flatten, Demand for Mortgages Falls as Rates Climb.” Accessed Apr. 22, 2024.
- Federal Reserve Bank of St. Louis, “30-Year Fixed Rate Mortgage Average in the United States.” Accessed Apr. 22, 2024.
Figures