The most house-poor cities in America
+1 more

You may feel broke when your rent or mortgage payment is withdrawn from your checking account each month. For many, this feeling is temporary, passing as soon as the next paycheck arrives. But if that “broke” feeling lingers all month long, you might be “house-poor” — spending a disproportionate share of your income on housing costs, with little left to cover all your other expenses.
While some budgeting advice stipulates that you shouldn’t spend more than 30% of your income on housing, lenders often use a different metric to determine “how much house” you can afford. According to the 28/36 rule, you should spend no more than 28% of the income you earn each month on housing costs and no more than 36% on all debt payments (think credit cards, student loans, car notes and mortgage payments).
In today’s housing market, the combination of rising home values and rampant inflation hasn’t just pushed homeownership further out of reach for many would-be buyers. It’s also stretched the limits for folks who already own homes, especially those with lower household incomes.
Median home prices have risen by more than 85% in the past ten years, but being house-poor isn’t only a matter of what your home costs. Even if you’ve secured a great mortgage lender, the cumulative sum of property taxes, homeowners insurance, utilities and HOA fees can all tip the balance to bust even the most well-intentioned budget.
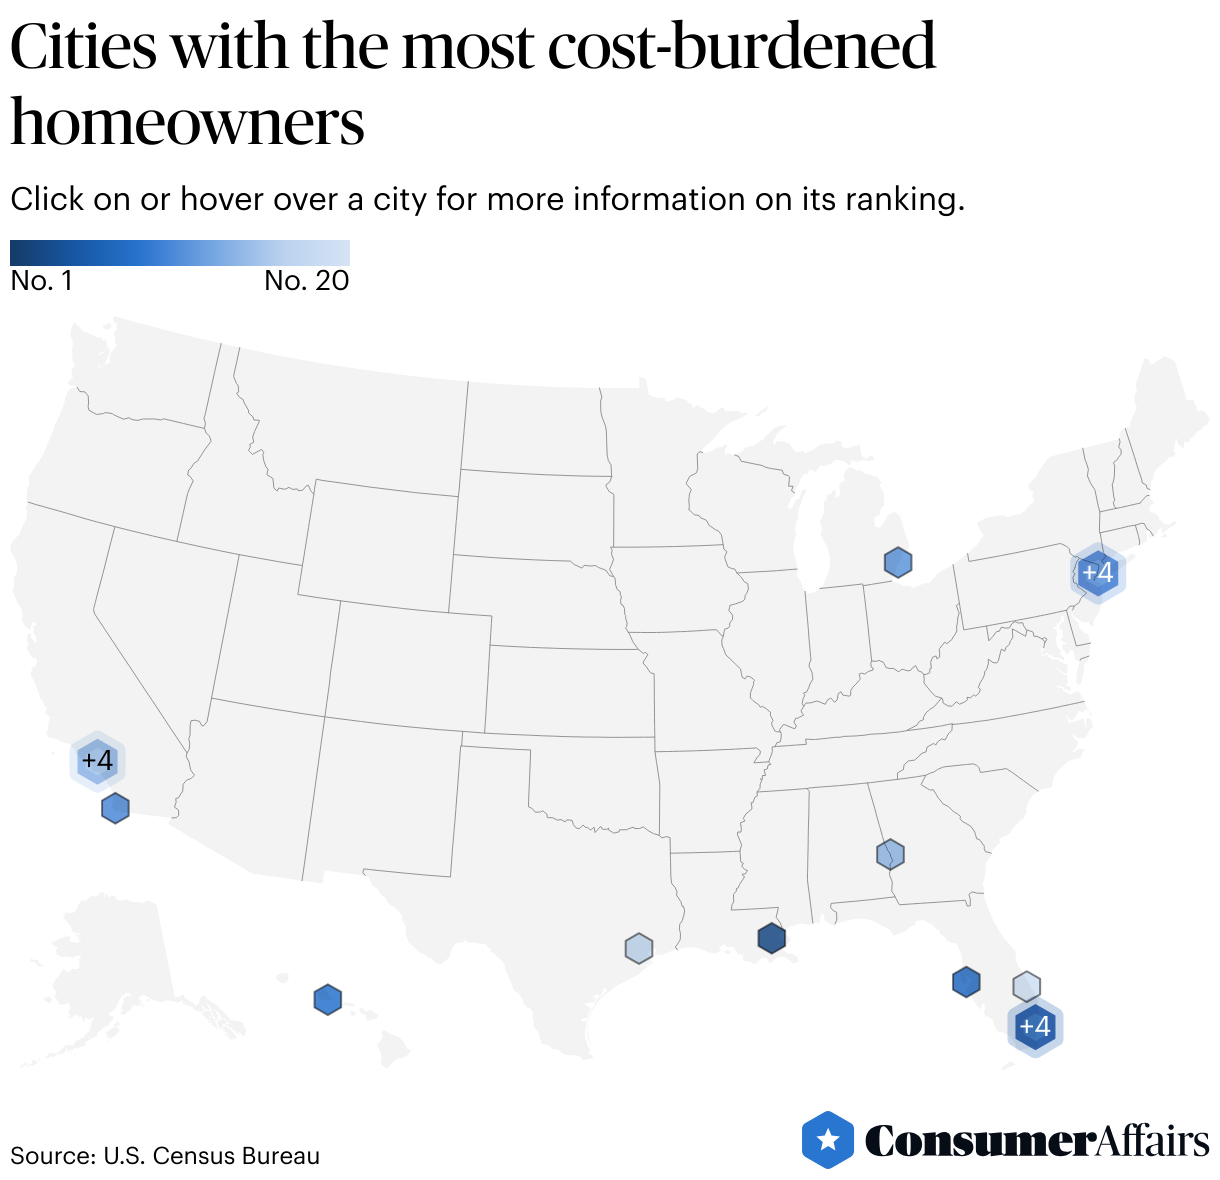
To find which cities face the largest housing cost burdens, ConsumerAffairs analyzed the latest Census data from 2024 for U.S. cities with populations over 175,000. Using the 28% affordability benchmark as our guide, we ranked cities by the share of median homeowner income spent on housing costs. Read on to find out where your city lands.
Hialeah, Florida, is the most house-poor city in the country. The typical homeowner there spends 36.9% of their income on housing costs.
Jump to insightNew York, New Orleans and Los Angeles aren’t far behind, with homeowners spending almost a third of their income on housing each month.
Jump to insightFlorida dominates the list of house-poor metros, with four cities ranking in the top 10.
Jump to insightIn the 20 most cost-burdened cities, homeowners spend more than 28% of their income on housing costs, exceeding the threshold recommended by lenders.
Jump to insightHomeowners in Chandler, Arizona, are the least cost-burdened. They spend less than 19% of their income on housing costs.
Jump to insightThe 10 cities with the most house-poor homeowners
The majority of the 10 most house-poor cities are located in one of three geographical clusters. Florida has four cities on the list, three of which are in the same metropolitan area in South Florida. Southern California has two cities in the top 10, and New York has two more. This all may not come as a huge surprise — these three states have some of the highest costs of living in America.
For a closer look at each city’s housing cost burden, check out the full analysis below.
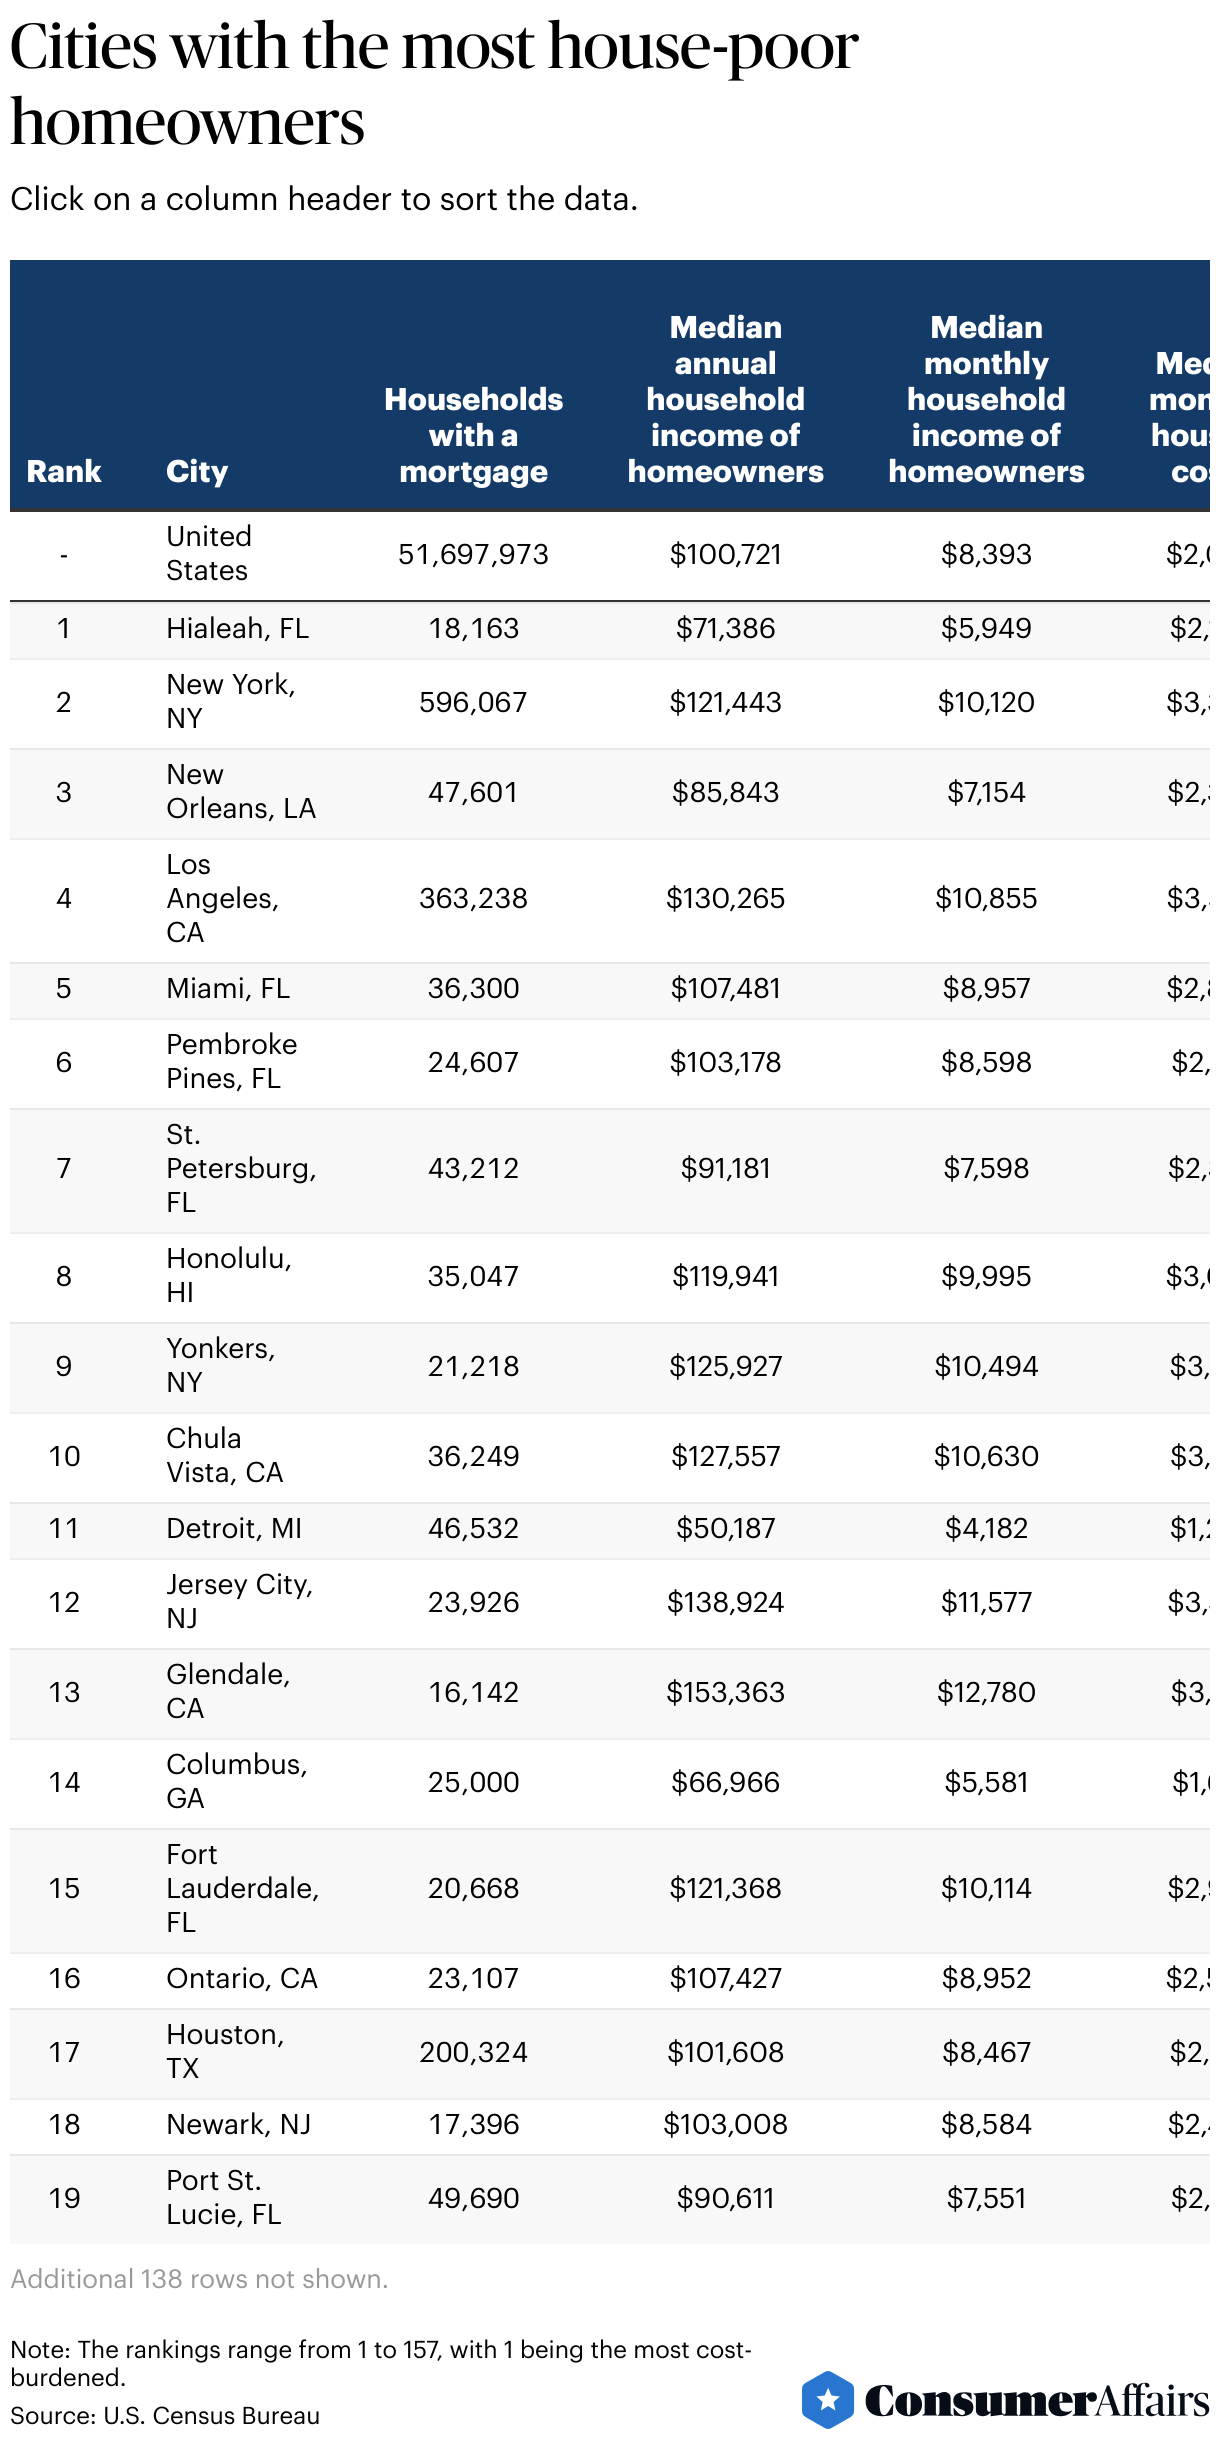
1. Hialeah, Florida
The most house-poor place in America is Hialeah, Florida, a city in the Miami metropolitan area. Two suburbs in the Miami-Fort Lauderdale-Pompano Beach metro area also land in the top 10: Miami (fifth worst) and Pembroke Pines (sixth worst). In the City of Progress, the typical homeowner spends 36.9% of their income on housing costs.
At about $2,200 a month, housing costs in Hialeah are only 7.5% higher than the national average. However, many residents don’t earn enough to comfortably manage those expenses. Hialeah has one of the lowest median household incomes of all the cities we analyzed — more than a third (34%) below the national median.
In recent years, the city’s housing cost burden has only gotten worse. From 2020 to 2024, median housing costs in Hialeah increased by 45%, while incomes only grew by 35%. That left homeowners 7.4% more house-poor.
What makes Hialeah the most house-poor city:
- Annual median household income for homeowners: $71,386
- Monthly median household income: $5,949
- Median monthly housing costs with a mortgage: $2,193
- Cost burden percentage: 36.9%
2. New York, New York
In New York City, homeowners spend nearly a third of their income on housing costs each month. The median household income among the Big Apple homeowners is 18.7% higher than the national average. However, monthly housing costs in the city are 48% higher.
In recent years, many New Yorkers have become not just cost-burdened, but “severely cost-burdened,” spending more than 50% of their income on housing costs. In 2022, approximately 1 in 5 households in the city fell into this category.
To make matters worse, the city has some of the highest and fastest-rising home prices in the country, increasing by 9% from April 2024 to April 2025.
What makes New York the second most house-poor city:
- Annual median household income for homeowners: $121,443
- Monthly median household income: $10,120
- Median monthly housing costs with a mortgage: $3,335
- Cost burden percentage: 33%
3. New Orleans, Louisiana
The third most house-poor city in America is New Orleans, Louisiana. Homeowners there spend 32.6% of their monthly income on rent. Among the top 10 most house-poor cities, the Big Easy is a bit of an anomaly. It’s the only city where 2024 median home values are below the national average ($305,100 compared with $360,600).
But the typical monthly housing costs are 13.6% more than the national average. As the climate continues to change, the area faces intensifying heat and increased tropical storm risk. As a result, home insurance rates and utility costs have soared, stretching residents’ housing budgets to the limit.
New Orleans became 6.1% more house-poor from 2020 to 2024. But from 2023 to 2024, the city actually became slightly less house-poor. The city’s housing costs rose slightly (2.1%) year over year, but the median household income rose more (7.1%). And statewide, property insurance rates have been climbing at a slower rate, thanks to legislation passed in 2024.
What makes New Orleans the third most house-poor city:
- Annual median household income for homeowners: $85,843
- Monthly median household income: $7,154
- Median monthly housing costs with a mortgage: $2,332
- Cost burden percentage: 32.6%
4. Los Angeles, California
The City of Angels ranks fourth worst for housing cost burdens. Homeowners spend 32.5% of their income on housing costs. At more than $3,500, the median monthly housing costs in Los Angeles are the highest of the top 10 most house-poor cities and the ninth highest in the country. Overall, Angelenos are just a hair better off than homeowners in New Orleans: The difference in cost burden percentage between the two cities is just a tenth of a point.
Property taxes make up a significant part of the housing expenses in LA. The effective tax rate is only 0.69%. That’s lower than 112 of the cities we analyzed, and the second-lowest rate among the top 10 most house-poor cities. But home values in Los Angeles are sky-high — the median home value last year was $947,900. Ultimately, a typical household paid $6,918 in property taxes in 2024. That’s 93% higher than the national median property taxes paid last year.
What makes Los Angeles the fourth most house-poor city:
- Annual median household income for homeowners: $130,265
- Monthly median household income: $10,855
- Median monthly housing costs with a mortgage: $3,523
- Cost burden percentage: 32.5%
5. Miami, Florida
The fifth most house-poor city in the U.S. is Miami, Florida. The typical Magic City homeowner spends nearly a third of their income on housing costs. Miamians only earn 6.5% more than the national median household income, but housing costs in Miami are almost $2,900 a month. That’s 35% higher than the national average.
Much of Miami’s economy is driven by low-wage sectors, like health, hospitality and services. This means that many households don’t make enough to comfortably afford a home. Analysts predict that future job growth will be mostly low-wage: Seven out of the 10 occupations expected to create the most jobs by 2030 are projected to earn under $18 an hour. That’s a salary of roughly $37,000 a year, but Miami households need to earn $176,438 a year to afford the typical monthly home payments.
What makes Miami the fifth most house-poor city:
- Annual median household income for homeowners: $107,481
- Monthly median household income: $8,957
- Median monthly housing costs with a mortgage: $2,893
- Cost burden percentage: 32.3%
6. Pembroke Pines, Florida
The least populous city to make the top ten, Pembroke Pines has the sixth most cost-burdened homeowners in the nation. In this Miami suburb, homeowners spend 32% of their income each month on housing costs.
From 2023 to 2024, Pembroke Pines saw a notable increase in the housing cost burden. Housing costs rose 11%, while median household incomes fell 2%. That left the typical Pembroke Pines homeowner 13% more house-poor.
Over the past several years, Floridians have faced staggering increases in their home insurance rates. The increased frequency and severity of damaging tropical storms and hurricanes has driven higher costs for repair, rebuilding and new construction. This has pushed insurance premiums higher. However, legislation aimed at addressing insurance claim fraud and excessive litigation has begun to stabilize the market. Home insurance premiums stayed almost steady in 2023 and 2024.
What makes Pembroke Pines the sixth most house-poor city:
- Annual median household income for homeowners: $103,178
- Monthly median household income: $8,598
- Median monthly housing costs with a mortgage: $2,751
- Cost burden percentage: 32%
7. St. Petersburg, Florida
The typical household income in St. Petersburg is only 10% below the national average. However, monthly housing costs are 13.2% higher. That makes homeowners in St. Petersburg, Florida, the seventh most cost-burdened in America. They spend 30.6% of their income on housing-related costs each month.
That’s a sharp increase from the prior year. In 2023, homeowners stayed well within the recommended 28/36 rule, only spending about 26.4% of their income on housing costs. And it isn’t just a year-over-year blip: From 2020 to 2024, St. Petersburg had the largest increase in housing costs and cost burden of all the cities we analyzed.
While this trend is troubling, the movement for housing affordability in St. Pete — and Florida at large — recently scored a notable win. In June 2025, the state legislature passed SB 1730. The bill expands on 2023’s “Live Local Act,” a bill that significantly expanded zoning for residential development. SB 1730 also opens the door for religious institutions to build housing on land they own, as long as at least 10% of it is considered affordable.
What makes St. Petersburg the seventh most house-poor city:
- Annual median household income for homeowners: $91,181
- Monthly median household income: $7,598
- Median monthly housing costs with a mortgage: $2,322
- Cost burden percentage: 30.6%
8. Honolulu, Hawaii
The typical Honolulu household earns nearly $10,000 a month, but housing costs eat up more than 30% of that income. Additionally, median home values on the island are astronomically high — 136% higher than the national median. These factors make Honolulu the eighth most house-poor city in the nation.
Notably, Honolulu homeowners are slightly less house-poor now than they were in 2020. (That year, households spent more than 31% of their income on housing costs.) And that’s not the only sign that efforts across the islands may be starting to gradually turn the tide of the state’s housing affordability crisis. As housing supply has increased, condo prices have fallen slightly, and rent prices are growing at a slower rate than the national average.
Despite the high housing costs, Honolulu offers its residents some relief in the form of a low effective property tax rate. It was 0.28% in 2023, the lowest in the country.
What makes Honolulu the eighth most house-poor city:
- Annual median household income for homeowners: $119,941
- Monthly median household income: $9,995
- Median monthly housing costs with a mortgage: $3,045
- Cost burden percentage: 30.5%
9. Yonkers, New York
You don’t need to get lost in Yonkers to feel dizzy over the city’s steep housing cost burden. It's the ninth worst in the country.
Like several cities in the top 10 list, Yonkers has a fairly high household income. At nearly $10,500 a month, it’s 22% more than the rest of the country. But housing costs in this city are nearly $3,200 a month — 44% higher than the rest of the U.S. Ultimately, Yonkers homeowners spend more than 30% of their income on housing costs.
A significant chunk of those housing costs comes from property taxes. Yonkers has some of the highest in the nation, with the median household paying more than $10,000 each year. (Of all the cities we analyzed, just four others — all in California — land in that highest property tax “bracket.”)
Unfortunately for homeowners, rates are increasing. Yonkers’ 2025 budget included a 5.45% property tax increase. The 2026 budget passed by the Yonkers City Council in May 2025 includes a further increase of 2.85%.
What makes Yonkers the ninth most house-poor city:
- Annual median household income for homeowners: $125,927
- Monthly median household income: $10,494
- Median monthly housing costs with a mortgage: $3,170
- Cost burden percentage: 30.2%
10. Chula Vista, California
Rounding out the list is Chula Vista, California, the former “Lemon Capital of the World.” Chula Vista is part of the San Diego metro area, and it joins Los Angeles in representing Southern California among the 10 most house-poor cities.
Of those 10 cities, Chula Vista experienced the sharpest year-over-year increase in housing cost burden from 2023 to 2024. In 2023, homeowners spent about a quarter of their income on housing costs. That's within the recommended 28% limit. But in 2024, that number climbed to 29.5%.
Now, zoom out to look at the housing cost burden faced by all residents, not just existing homeowners. The San Diego metro area is the third-most cost-burdened housing market in the country. A typical family would need to spend 67% of their monthly income to make a mortgage payment on an existing home.
What makes Chula Vista the tenth most house-poor city:
- Annual median household income for homeowners: $127,557
- Monthly median household income: $10,630
- Median monthly housing costs with a mortgage: $3,132
- Cost burden percentage: 29.5%
The 10 cities with the least cost-burdened homeowners
Among the cities where homeowners are the least house-poor, a few geographical clusters are present. North Carolina has three cities at the bottom of the list; Durham and Cary are especially close neighbors in the “Research Triangle” area. Arizona is represented by two cities, both in the Phoenix metro area. The Rust Belt region has two cities on the list. The remaining cities are scattered across the West, South and Midwest.
Not being “house-poor” doesn’t necessarily mean you’re raking in the dough, though. In Grand Rapids, Michigan and Toledo, Ohio, the median monthly income is well below the national average. However, their typical housing costs are among the lowest in the nation.
The least “house-poor” cities in America are:
- Chandler, Arizona
- Cary, North Carolina
- Huntsville, Alabama
- Durham, North Carolina
- Toledo, Ohio
- Gilbert, Arizona
- Madison, Wisconsin
- Grand Rapids, Michigan
- Salt Lake City, Utah
- Charlotte, North Carolina
Chandler, Arizona, has the least house-poor homeowners in the nation. They spend only 18.4% of their income on housing costs. But other cities on the list stand out as great places to live, with affordable housing and a high quality of life, according to our other studies:
- Gilbert, Arizona, is one of the most accessible cities for first-time homebuyers. Millennial and Gen Z residents have a combined homeownership rate of 26.8%, the highest in the nation.
- On the other side of the country, Cary, North Carolina, ranks as the best place to move to in the South. It boasts a low cost of living, a strong economy and a highly-educated population.
How housing costs compare across U.S. cities
In recent years, housing costs have been rising faster than incomes across the country. From 2020 to 2024, the national median household income rose by 24%. During the same period, median monthly housing costs increased by 26%. Nationwide, homeowners are only about 1% more cost-burdened than they were five years ago. But the reality in some cities is far more extreme, with housing costs rising as much as 40% to 50% in that short period.
Check out the full data below to see how your city stacks up. (Note that the top 20 cities all exceed the 28% affordability threshold. That means homeowners in these cities are considered cost-burdened by the 28/36 rule of traditional lending.)
How to avoid becoming house-poor
“House poor, to me, is being able to own your home but struggling so much with the mortgage that (you) can’t afford other priorities like health care, savings or even hobbies,” said Nico Real, a real estate agent with The Real Estate Ranch, a Texas-based firm.
If that description resonates, you might be house-poor yourself — or close to the edge. Whether you’re a first-time homebuyer or revisiting how much you’re spending on your existing home, check out these tips to keep a balanced budget.
- Stick to the 28% rule. Lenders may approve you for more than you can comfortably afford, but “shooting to the top of your loan approval is a big red flag,” said Real. “Just because you got a high credit limit on your card doesn’t mean you should max it out.”
- Factor in hidden costs. Expenses like property taxes, home insurance and HOA fees can quickly add up. And don’t forget to leave yourself plenty of wiggle room for maintenance and repair costs. “Buyers often get surprised at the cost of plumbing, HVAC, electrical, roofing fixes, or even maintaining a nice yard,” Real said.
- Build in a cushion. Leave room in your budget for emergencies and other unexpected expenses. This is especially important to keep in mind if you’re transitioning out of the rental market. “There’s no landlord to fix things for you anymore,” Real said.
- Shop around for mortgages. Even a 0.5% rate difference can save thousands each year. And trust your gut if your lender seems overly eager to get you to sign on the dotted line. “A good lender should calculate your payments before you even look at the house,” Real said.
- Don’t get carried away. “Buyers will often throw out financial reasoning when their ‘dream home’ pops up,” Real said. “Stay grounded and make sure your dream home doesn’t throw you into a financial nightmare.”
Methodology
The ConsumerAffairs research team ranked U.S. cities with the most and least house-poor homeowners using 2024 American Community Survey (ACS) 1-Year Estimates, released by the U.S. Census Bureau in September 2025. To ensure reliability, we only included cities with populations of at least 175,000.
Rankings were determined by each city’s median cost burden percentage — the share of median homeowner income spent on monthly housing costs. Cities where this percentage exceeded the 28% affordability benchmark were considered more house-poor.
To add context to the rankings, we gathered additional data points, including:
- Number of households with a mortgage (2024)
- 2023 comparisons for household income and housing costs
- Year-over-year changes in cost burden from 2023 to 2024
- Median home values (2024)
- Median property taxes paid (2024)
- Effective county-level property tax rates (2023)
These data points did not influence city rankings but helped illustrate broader trends and regional differences. County-level property tax rates are from the Tax Foundation.
We also made small adjustments to account for reporting limits in the Census data. In some cases, the ACS caps reported values at maximum thresholds (e.g., more than $250,000 for income, more than $4,000 for monthly housing costs and more than $10,000 for property taxes). For consistency, we replaced those values with the stated cap amount. Additionally, 62 cities were excluded from the analysis because the Census reported “null” values for the number of owner-occupied households with a mortgage.
Reference policy
We love it when people share our findings! If you do, please link back to our original article to credit our research.
Questions?
For questions about the data or if you'd like to set up an interview, please contact rsowell@consumeraffairs.com.
Article sources
ConsumerAffairs writers primarily rely on government data, industry experts and original research from other reputable publications to inform their work. Specific sources for this article include:
- U.S. Census Bureau, "DP05 | ACS Demographic and Housing Estimates." Accessed Oct. 6, 2025.
- U.S. Census Bureau, "B25081 | Mortgage Status." Accessed Oct. 6, 2025.
- U.S. Census Bureau, "B25119 | Median Household Income in the Past 12 Months (in 2024 Inflation-Adjusted Dollars) by Tenure." Accessed Oct. 6, 2025.
- U.S. Census Bureau, "B25119 | Median Household Income in the Past 12 Months (in 2023 Inflation-Adjusted Dollars) by Tenure." Accessed Oct. 6, 2025.
- U.S. Census Bureau, "B25119 | Median Household Income the Past 12 Months (in 2020 Inflation-Adjusted Dollars) by Tenure." Accessed Oct. 6, 2025.
- U.S. Census Bureau, "B25088 | Median Selected Monthly Owner Costs (Dollars) by Mortgage Status." Accessed Oct. 6, 2025.
- U.S. Census Bureau, "B25088 | Median Selected Monthly Owner Costs (Dollars) by Mortgage Status." Accessed Oct. 6, 2025.
- U.S. Census Bureau, "B25077 | Median Value (Dollars)." Accessed Oct. 6, 2025.
- U.S. Census Bureau, "B25103 | Mortgage Status by Median Real Estate Taxes Paid (Dollars)." Accessed Oct. 6, 2025.
- Tax Foundation, "Property Taxes by State and County, 2025." Accessed Oct. 6, 2025.
- Harvard Joint Center for Housing Studies, "House Poor: Low-Income Homeowners Struggle in the Shadows." Accessed Oct. 6, 2025.
- Office of the New York State Comptroller, "New Yorkers in Need: The Housing Insecurity Crisis." Accessed Oct. 6, 2025.
- Louisiana Department of Insurance, "Commissioner Temple Highlights Positive Trends in Louisiana Property Insurance Market." Accessed Oct. 6, 2025.
- Verite News, "'There’s no end in sight': Entergy bills rising at historic pace." Accessed Oct. 6, 2025.
- New Orleans Public Radio, "Rising temperatures, utility bills take heavy toll on seniors in the Lower 9th Ward." Accessed Oct. 6, 2025.
- Miami Homes For All, "How do we address Miami’s housing crisis?" Accessed Oct. 6, 2025.
- HBKS Wealth Advisors, “Understanding the Rising cost of Homeowners Insurance in Florida.” Accessed Oct. 6, 2025.
- Insurance Information Institute, "Triple-I: Florida’s P/C Market Stabilizing Due to Legislative Reforms that Curbed Legal System Abuse Practices of Billboard Attorneys." Accessed Oct. 6, 2025.
- The Florida Senate, "Senate Bill 1730 (2025) - The Florida Senate." Accessed Oct. 6, 2025.
- Reason Foundation, "Florida Senate Bills 1730 and 180 are solid housing reforms." Accessed Oct. 6, 2025.
- UHERO, “The Hawai’i Housing Factbook 2025.” Accessed Oct. 6, 2025.
- City of Yonkers, “Adopted Budget Fiscal Year 2024.” Accessed Oct. 6, 2025.
- City of Yonkers, “Adopted Budget Fiscal Year 2025.” Accessed Oct. 6, 2025.
- City of Yonkers, “Adopted Budget Fiscal Year 2026.” Accessed Oct. 6, 2025.
- National Association of Home Builders, "New and Existing Homes Remain Largely Unaffordable in Second Quarter." Accessed Oct. 6, 2025.
Figures