Northeastern Cities with the Worst Drivers 2026
+2 more
While a road trip in the Northeast might offer scenic views, drivers need to be aware of challenges in the region that can lead to accidents, including winter weather, older infrastructure and road congestion. But there’s another factor that can compound any of these risks and make a challenging driving situation worse: bad drivers.
Even if you take all the right steps to protect your car and yourself, encountering a reckless driver can put you in a bad spot. Drivers in several Northeastern cities face especially dangerous conditions — whether from speeding, impaired driving or a mix of risky behaviors — and should stay alert to avoid potentially deadly accidents.
The ConsumerAffairs Research Team analyzed the National Highway Traffic Safety Administration’s latest fatal car crash data to identify the Northeastern cities with the worst drivers. Keep reading to see which cities made the list.
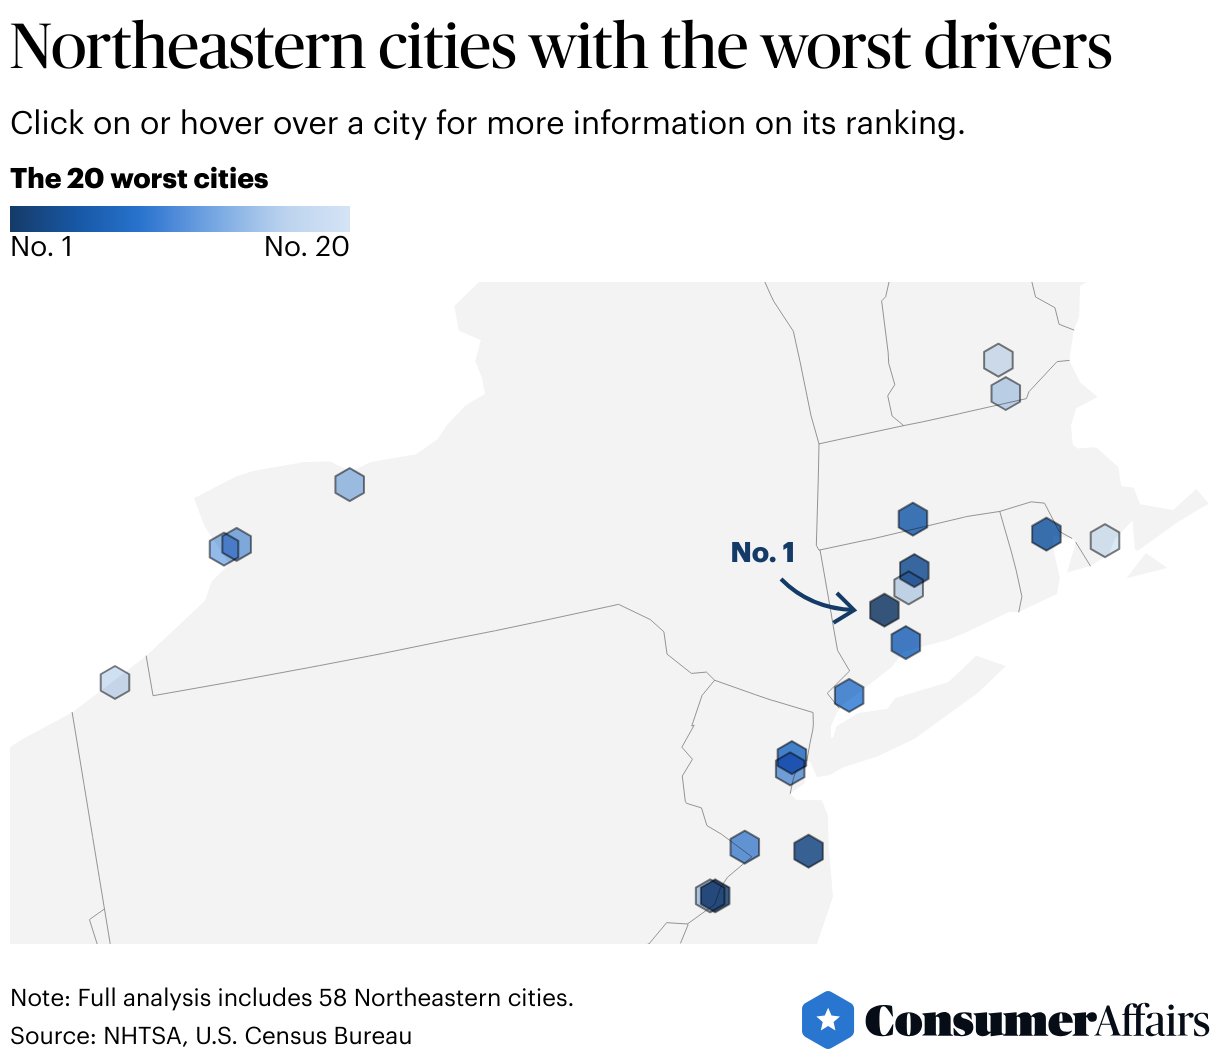
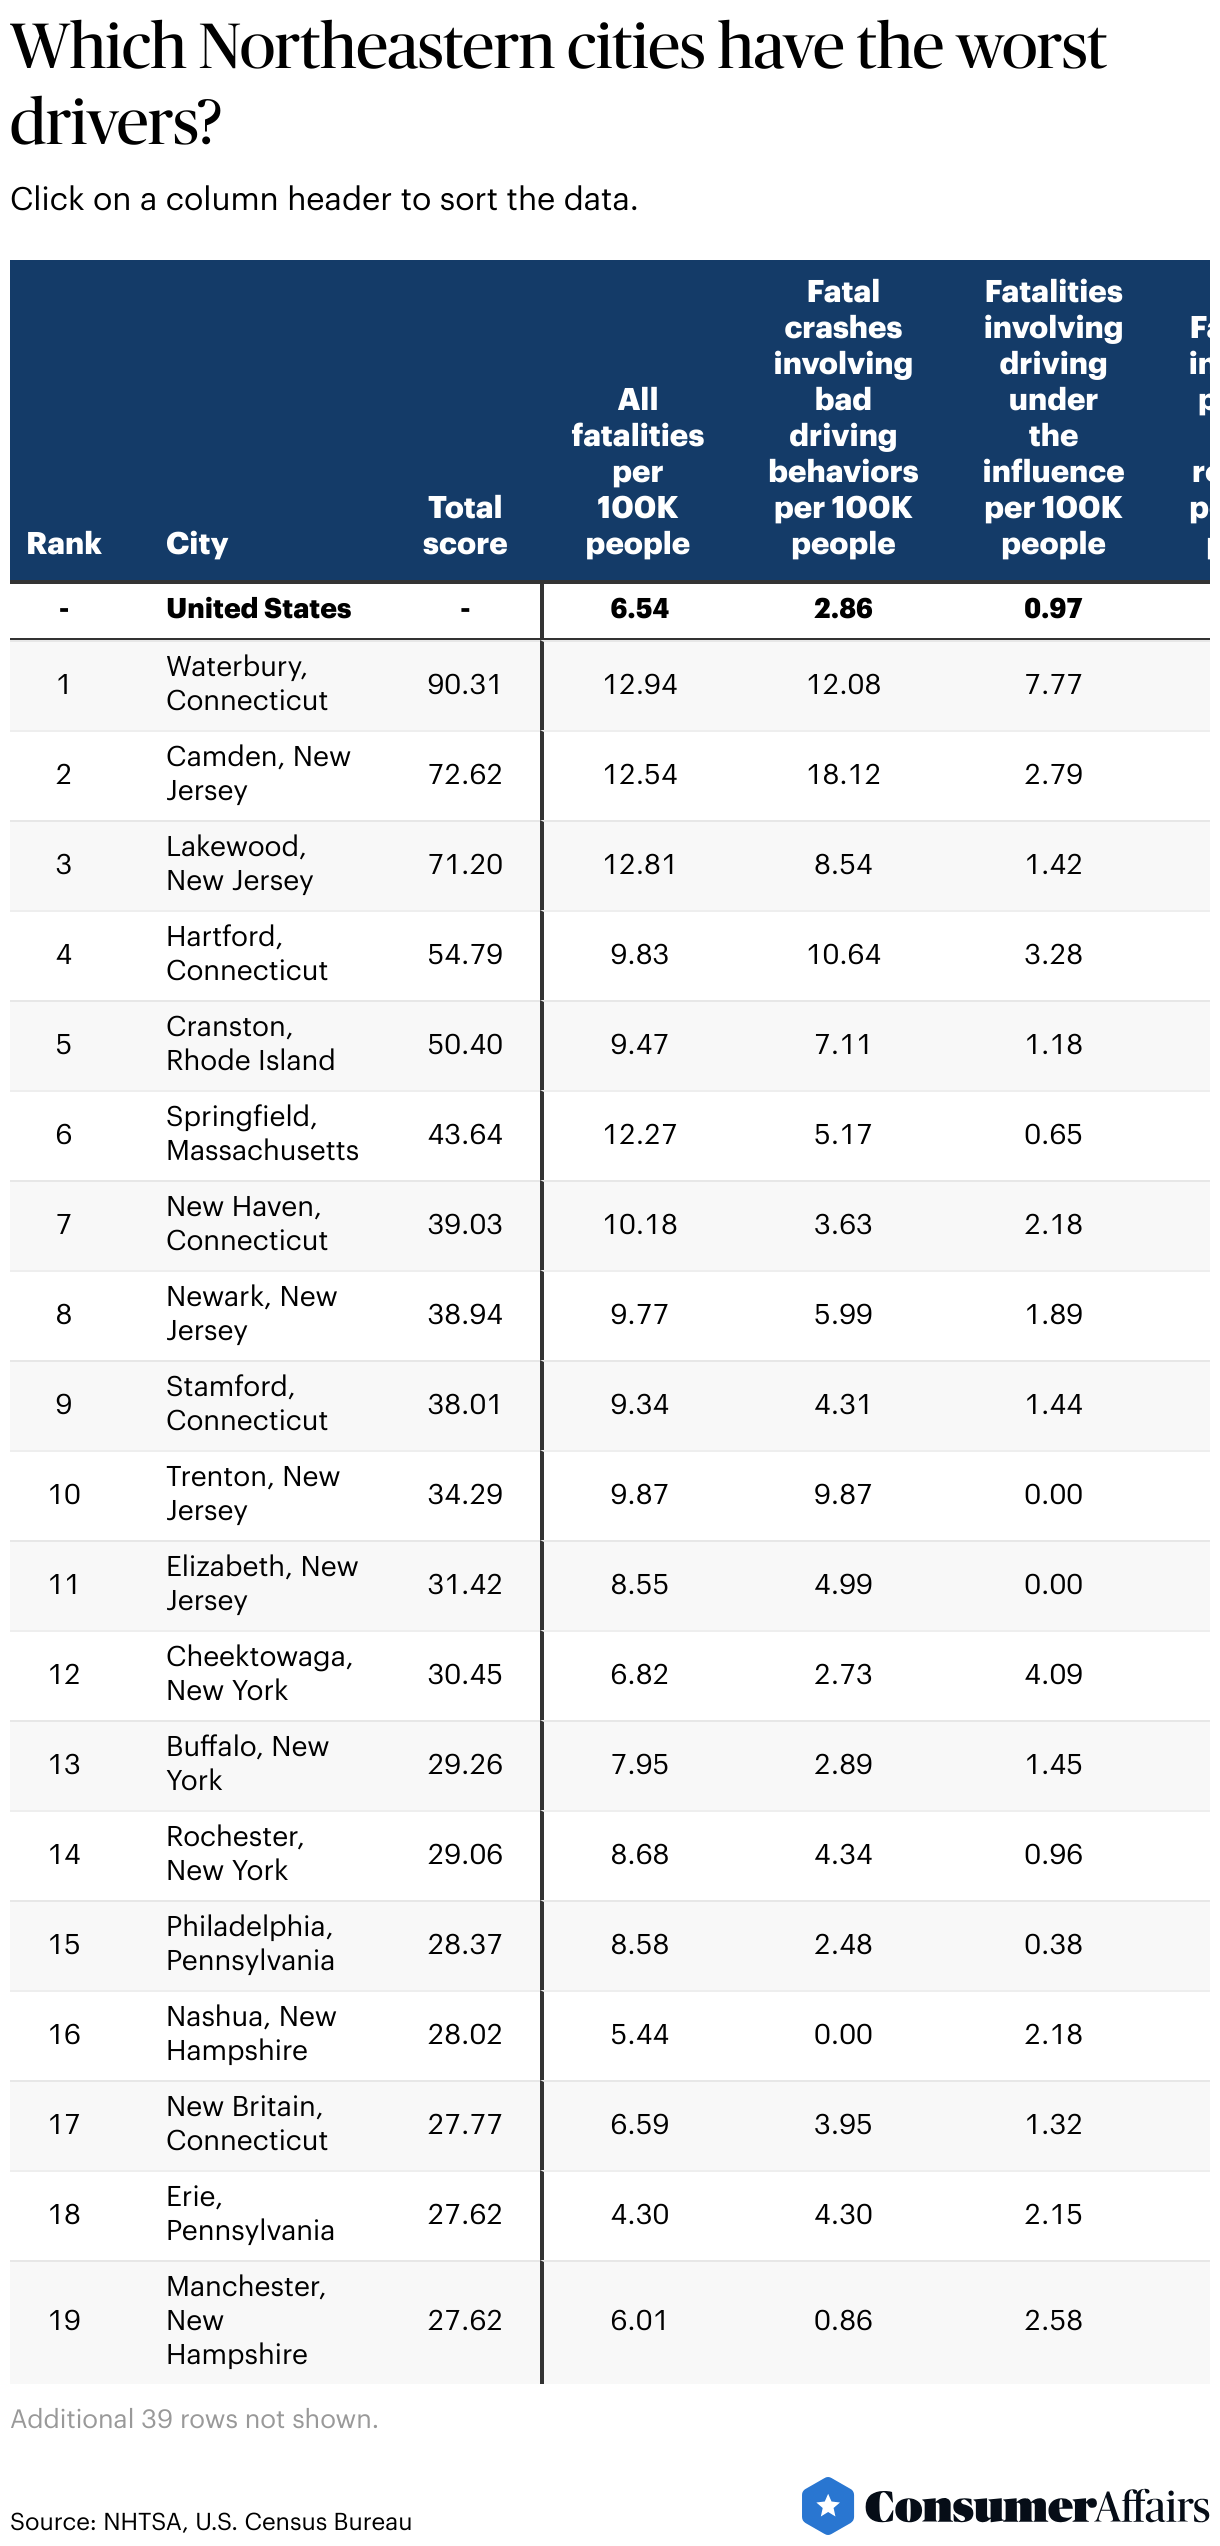
The Northeast’s worst drivers are in Waterbury, Connecticut. The city’s number of traffic fatalities per 100,000 people is nearly double the national average.
Jump to insightConnecticut and New Jersey dominate the top 10, with four cities each.
Jump to insightLakewood, New Jersey, has the third-worst drivers overall, primarily due to its having the highest rate of fatal crashes involving positive blood alcohol content (BAC) readings. It also has a high rate of fatalities related to speeding.
Jump to insightLowell, Massachusetts, has the lowest rate of fatal crashes among the cities we analyzed. It recorded one traffic fatality in 2023 —that’s a rate of 0.83 deaths per 100,000 people.
Jump to insightFive Northeastern cities with the worst drivers
The first four cities in our top five are in Connecticut or New Jersey. That’s interesting, given that both states had laws go into effect in 2025 attempting to combat bad driving habits, such as Connecticut's law requiring drivers to watch a video presentation at every other license renewal and New Jersey’s law implementing strict practice driving requirements for young drivers with permits.
1. Waterbury, Connecticut
Waterbury, Connecticut, ranks first on our list — no surprise, given that the city has a total fatality rate of 12.94 per 100,000 people. It also ranks No. 1 on our list for fatal crashes involving driving under the influence and fatal crashes involving speeding. Notably, Waterbury also places third in our ranking of the worst drivers in the U.S.
It’s worth noting that Connecticut is making an effort to educate its drivers about safe driving — a 2025 law mandates that at every other license renewal, drivers must watch a video presentation that covers “ways to practice safe driving behaviors and reduce transportation-related fatalities and severe injuries.”
Here are the key metrics:
- Fatalities across all possible crash types: 12.94 per 100,000 people
- Fatal crashes involving bad driving behaviors: 12.08 per 100,000 people
- Fatalities involving driving under the influence: 7.77 per 100,000 people
- Fatalities involving positive BAC readings: 6.04 per 100,000 people
- Fatalities involving speeding: 7.77 per 100,000 people
2. Camden, New Jersey
Camden ranks high on our list primarily due to its outsize rate of fatal crashes involving bad driving: at 18.12 per 100,000 people, it’s over six times the national figure. The city also has a high rate of total fatalities, at 12.54 per 100,000.
However, young drivers in New Jersey can look forward to stricter driving practices that may help combat this trend. As of February 2025, permit holders under 21 must complete 50 hours of practice driving, including 10 at night, before they can get a probationary driver's license.
Check out the data:
- Fatalities across all possible crash types: 12.54 per 100,000 people
- Fatal crashes involving bad driving behaviors: 18.12 per 100,000 people
- Fatalities involving driving under the influence: 2.79 per 100,000 people
- Fatalities involving positive BAC readings: 4.18 per 100,000 people
- Fatalities involving speeding: 5.57 per 100,000 people
3. Lakewood, New Jersey
Lakewood ranks third on our list due to its having the highest rate of fatalities involving positive BAC readings, at 7.12 per 100,000 people. Interestingly, the state ranks much lower for fatalities involving driving under the influence, but it's important to note that driving under the influence covers both alcohol and drugs, while BAC only relates to alcohol.
Lakewood also has a high number of speeding-related fatalities — 7.12 per 100,000 people — which no doubt contributes to the state’s sixth-place ranking among the worst states for road rage.
Here are the important numbers:
- Fatalities across all possible crash types: 12.81 per 100,000 people
- Fatal crashes involving bad driving behaviors: 8.54 per 100,000 people
- Fatalities involving driving under the influence: 1.42 per 100,000 people
- Fatalities involving positive BAC readings: 7.12 per 100,000 people
- Fatalities involving speeding: 7.12 per 100,000 people
4. Hartford, Connecticut
Hartford has a high rate of fatal crashes involving bad driving, at 10.64 per 100,000 people, which is third highest on our list. While this rate is high, it looks like Hartford is taking steps to combat it. Recently, the City Council approved the installation of speed and red light cameras in school zones that have high numbers of traffic accidents.
Explore the key facts:
- Fatalities across all possible crash types: 9.83 per 100,000 people
- Fatal crashes involving bad driving behaviors: 10.64 per 100,000 people
- Fatalities involving driving under the influence: 3.28 per 100,000 people
- Fatalities involving positive BAC readings: 3.28 per 100,000 people
- Fatalities involving speeding: 4.09 per 100,000 people
5. Cranston, Rhode Island
Cranston, the only city in Rhode Island in our top five, ranks third in deaths involving speeding. Its rate of 5.92 per 100,000 is three times the national number. In general, Rhode Island may have a speeding problem, with three out of four of the state’s cities on our list outpacing the national rate of deaths related to speeding. However, it’s worth noting that a number of Rhode Island cities are in the process of installing or are considering installing speed cameras in school zones.
Read on for the data:
- Fatalities across all possible crash types: 9.47 per 100,000 people
- Fatal crashes involving bad driving behaviors: 7.11 per 100,000 people
- Fatalities involving driving under the influence: 1.18 per 100,000 people
- Fatalities involving positive BAC readings: 3.55 per 100,000 people
- Fatalities involving speeding: 5.92 per 100,000 people
How does the rest of the Northeast compare?
While Connecticut and New Jersey dominated our top 10, one state had cities rank particularly low on our list: Massachusetts. Of the 14 Bay State cities included in our list, 11 rank in the bottom half — including the lowest-ranked city on our list, Lowell, which has a traffic fatality rate that’s 87% lower than the national rate.
Tips to avoid accidents on Northeastern roads
Regardless of whether the drivers around you are engaging in unsafe behavior, driving safely should be the No. 1 priority when you’re out on the road. Here are some things to remember when driving in the Northeast and beyond:
- Slow down in winter weather. Northeastern winters bring heavy snow, black ice and rapidly changing conditions. Slowing down gives you more time to react on slick roads and helps you stay in control during sudden stops or turns.
- Check your tires. Cold snaps are common in the Northeast and can quickly drop tire pressure. Underinflated tires reduce traction on wet, icy or uneven roads, so check your pressure regularly and ensure your tread is winter-ready.
- Don’t drive distracted. Northeastern highways can be congested and fast-moving, especially near major metro areas. Looking at your phone even briefly can leave you unprepared for sudden traffic changes, lane shifts or road hazards.
- Drive defensively. From dense city traffic to winding rural roads, the Northeast demands extra awareness. Watch for aggressive drivers, bikers, pedestrians and unpredictable weather to avoid being caught off guard.
- Buckle up. No matter where you’re driving, always wear a seat belt. It’s one of the simplest and most effective ways to protect yourself in a crash.
Methodology
To determine which Northeastern cities have the worst drivers, the ConsumerAffairs Research Team analyzed the most recent crash data from the National Highway Traffic Safety Administration’s Fatality Analysis Reporting System (FARS). Our analysis includes cities with populations of 65,000 or more located in states classified as part of the Northeast by the U.S. Census Bureau.
To ensure every Northeastern state was represented, we made a special exception for South Burlington, Vermont, which has the state’s second-largest population but falls below our population threshold. (We initially planned to include Burlington, Vermont — the state’s largest city — but it had insufficient data in the NHTSA datasets.)
The following cities met our population threshold but were removed from the analysis due to insufficient NHTSA data: Cambridge, Massachusetts; Framingham, Massachusetts; Somerville, Massachusetts; and Mount Vernon, New York.
We looked at five crash factors:
- The number of fatalities across all possible crash types per 100,000 people
- The number of fatal crashes related to bad driving per 100,000 people (see bad driving factors below)
- The number of fatalities involving a positive blood alcohol content reading per 100,000 people
- The number of fatalities involving driving under the influence per 100,000 people
- The number of fatalities involving speeding per 100,000 people
Each city was scored out of 20 for each factor. The city with the highest rate of deaths or crashes received the maximum score, and all others received relative scores. We then added the individual scores together to get a total score, which has a maximum of 100 points.
Examples of bad driving behaviors include:
- Aggressive driving
- Careless, inattentive or improper driving; driving without due care
- Driving on the wrong side of a two-way road (intentional or unintentional)
- Driving the wrong way on a one-way road
- Failure to yield right of way
- Following improperly
- Improper lane usage
- Improper or erratic lane change
- Operating a vehicle in an erratic, reckless or negligent manner
- Operator inexperience
- Passing through or around a barrier
- Passing where prohibited by posted signs, pavement markings or a school bus displaying a warning not to pass
- Passing with insufficient distance or visibility, or failing to yield to an overtaking vehicle
Reference policy
We love it when people share our findings! If you do, please link back to our original article to credit our research.
Questions?
For questions about the data or if you'd like to set up an interview, please contact ljobe@consumeraffairs.com.
Article sources
ConsumerAffairs writers primarily rely on government data, industry experts and original research from other reputable publications to inform their work. Specific sources for this article include:
- U.S. Census Bureau, “B01003: Total Population.” Accessed Nov. 23, 2025.
- National Highway Traffic Safety Administration, “NHTSA File Downloads.” Accessed Nov. 23, 2025.
- Connecticut General Assembly, “Substitute for Raised H.B. No. 7160 Session Year 2025.” Accessed Dec. 1, 2025.
- New Jersey Motor Vehicle Commission, “NJMVC to Begin Implementing Law Requiring 50 Hours of Practice Driving for Under-21 Permit Holders.” Accessed Nov. 23, 2025.
- WFSB, “Hartford approves speed and red light cameras for school zones.” Accessed Nov. 23, 2025.
- WPRI, “Where are school-zone speed cameras located in RI?” Accessed Nov. 23, 2025.
Figures