Solar Capacity by State 2026
+4 more

In 2023, the United States generated approximately 4.18 trillion kilowatt-hours of total electricity at utility-scale power generation facilities, with renewable energy sources contributing roughly 21% of this total and solar power making up 3.9%.
Since 2010, solar power capacity in the United States has been consistently increasing. In 2022, however, there was a decline in the addition of utility-scale solar capacity compared with the previous year. This decrease was attributed to disruptions in the supply chain and pandemic-related challenges. However, developers plan to install 29.1 gigawatts (GW) of solar power in the U.S. during 2023, potentially setting a new record for the highest annual increase in utility-scale solar capacity.
It is estimated that in 2023, solar power will account for 54% of all new utility-scale electric-generating capacity in the U.S.
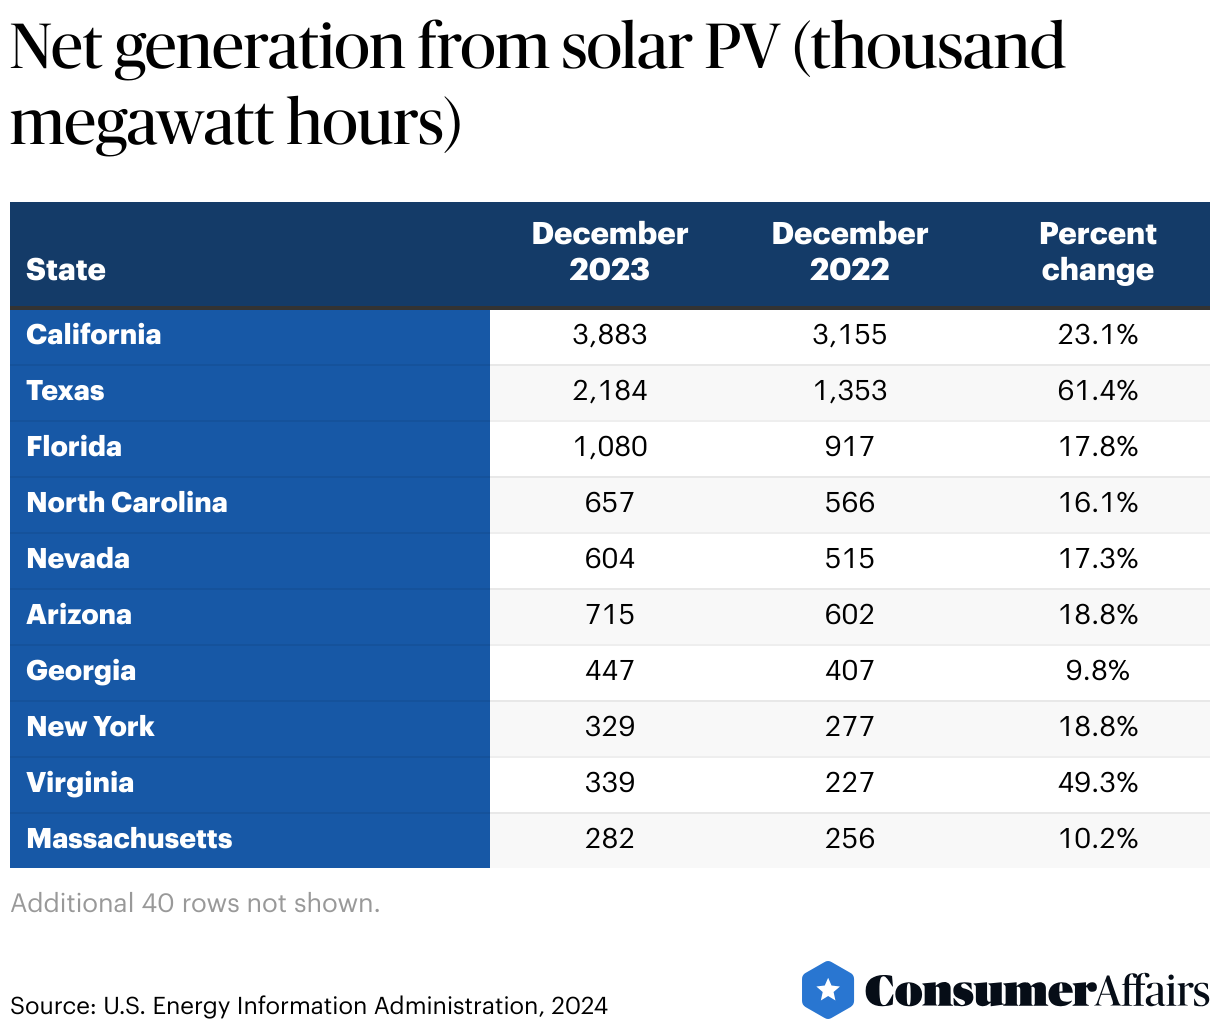
Montana experienced the most significant surge in net generation from solar PV energy over the past year, with more than a 433% increase from December 2022 to December 2023.
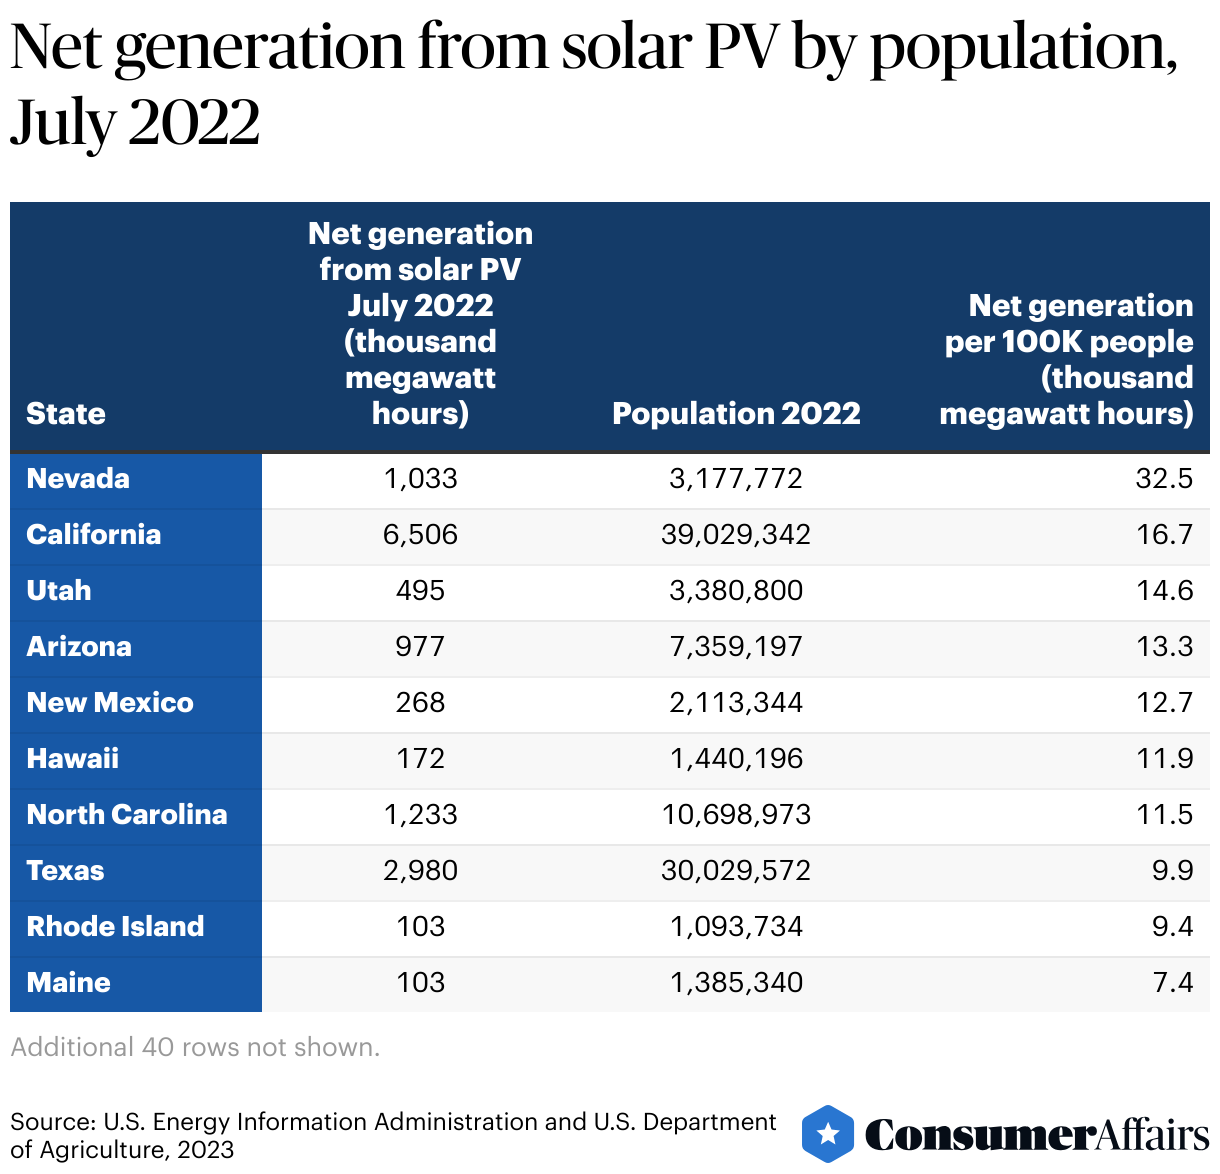
Jump to insightNevada leads the way when weighing net solar PV generation by the state’s population, with 32.5 thousand megawatt hours per 100K people.
Jump to insightCalifornia has set a goal of achieving 100% clean energy by 2045.
Jump to insightSince 2021, Florida, California and Texas have consistently ranked as the top states for solar PV installations.
Jump to insightBy 2040, solar power is anticipated to provide the biggest source of energy capacity for the entire U.S. electrical grid.
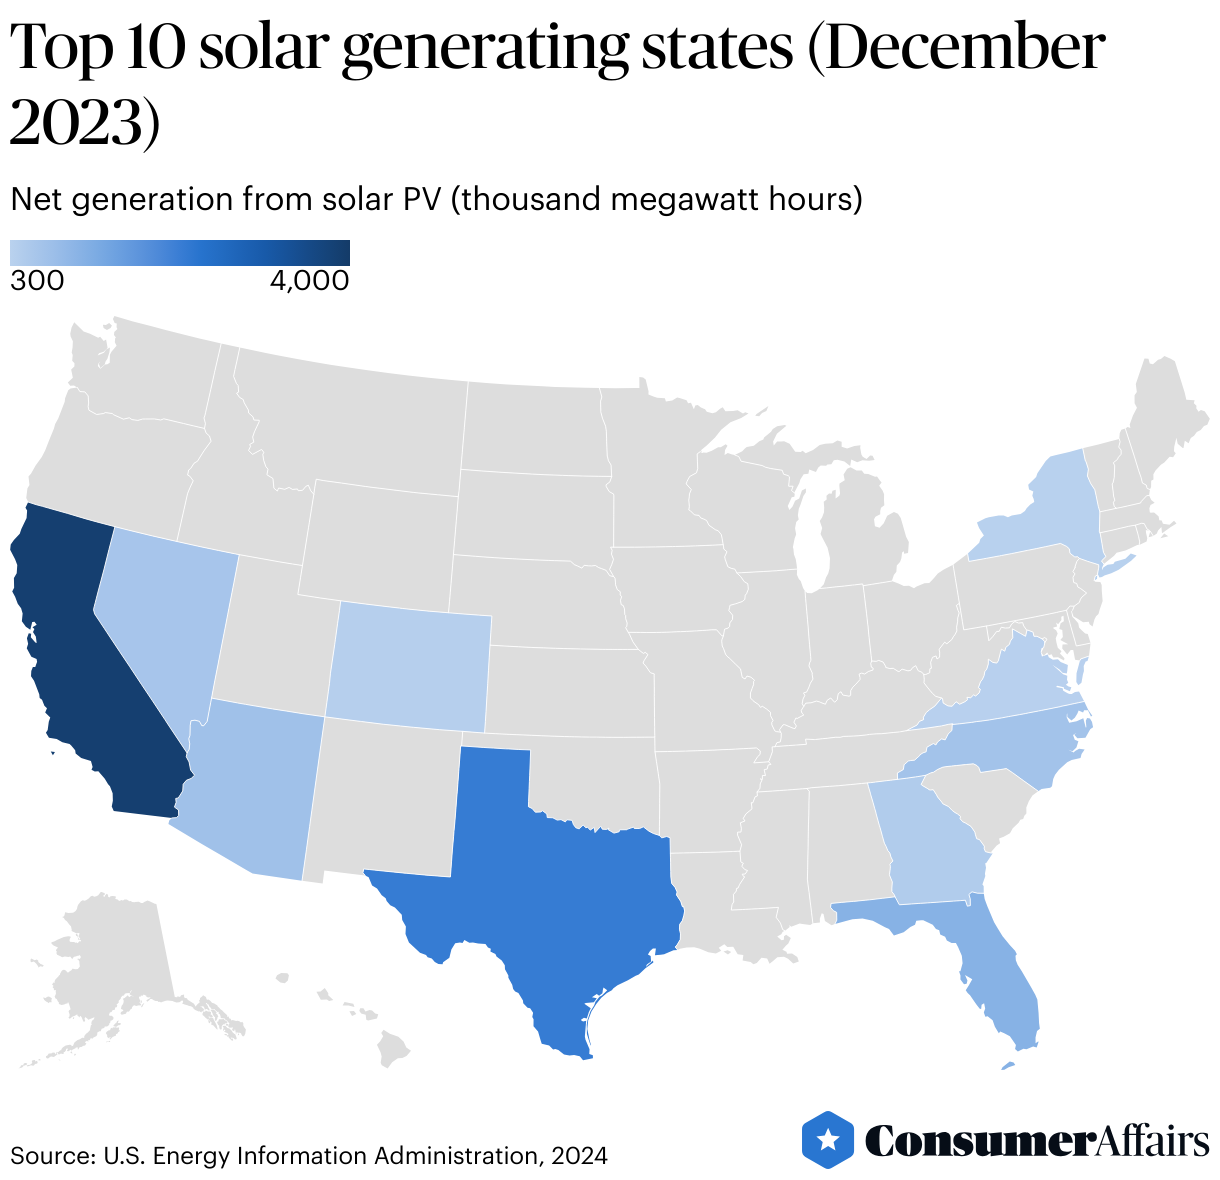
Jump to insightTop states for generating solar power
As of December 2023, California stands at the forefront in net generation from solar photovoltaic (PV) energy when measuring combined output from both utility-scale and small-scale facilities.
Based on December 2023 data from the U.S. Energy Information Administration, the top 10 states in net generation of solar PV power are:
- California
- Texas
- Florida
- Arizona
- North Carolina
- Nevada
- Georgia
- Colorado
- Virginia
- New York
However, Montana experienced the most significant surge in net generation from solar PV energy over the past year, with more than a 433% increase from December 2022 to December 2023.
In fact, during that same timeframe, a total of 17 states saw a net solar energy generation increase of at least 50% compared with the previous year. These states were Montana, New Mexico, Indiana, Texas, Colorado, Illinois, West Virginia, Mississippi, Tennessee, Minnesota, Wisconsin, Michigan, Pennsylvania, Arkansas, Ohio, Maine and Idaho.
Nevada leads the way when weighing net solar PV generation by the state’s population. The top 10 states in solar PV generation relative to their population, based on 2022 data, are:
- Nevada
- California
- Utah
- Arizona
- New Mexico
- Hawaii
- North Carolina
- Texas
- Rhode Island
- Maine
Detailed solar power generation summaries by state
Solar power capacity is steadily expanding throughout the United States, as more than half of the states now boast 1 gigawatt (GW) or greater of installed solar.
California
California has set an ambitious goal of achieving 100% clean energy by 2045. The state has been at the forefront of renewable energy generation and solar power generation in particular. In fact, solar power is the primary contributor to California's renewable electricity production. In 2022, solar energy contributed 19% of the state's utility-scale electricity net generation. When adding small-scale generation, solar energy accounted for 27% of the state's total electricity generation. The solar industry employs more than 78,000 throughout the state.
Texas
Texas has become one of the leading states in both solar energy potential and solar power generation. In 2022, it ranked as the nation's second-largest producer of solar power, following California, with solar energy making up approximately 5% of the state's total electricity output. According to the U.S. Department of Energy, by the end of 2023, Texas is expected to become the state with the highest amount of annually installed solar power capacity from utility-scale facilities.
Florida
In 2021, renewable sources accounted for approximately 6% of Florida's overall electricity production, with solar energy contributing around 70% of the state's renewable power generation. Utility-scale facilities created approximately 84% of the solar power generated in Florida. Despite the fact that Florida’s solar policies have not advanced as in other states (Florida lacks a renewable portfolio standard and does not permit power purchase agreements), the state ranked third in net solar PV power generation based on July 2023 data.
North Carolina
North Carolina has seen a significant surge in electricity generated from solar energy in the last few years. In 2017, for example, solar energy became the primary source of renewable electricity generation in the state, surpassing conventional hydroelectric power for the first time. North Carolina is now one of the leading states in utility-scale solar generation. The rapid growth of the state's solar industry can be attributed, in part, to its robust state policies and regulatory support, including its Renewable Energy and Energy Efficiency Portfolio Standard.
Nevada
Nevada has consistently ranked as a leading state in solar energy production, with a multitude of utility-scale, residential and commercial solar initiatives. The state’s share of electricity generation from solar sources has almost tripled since 2016. Solar energy accounted for 23% of Nevada’s overall electricity generation in 2022 and over 24% in the second quarter of 2023.
Arizona
For the first time in 2017, solar power generation surpassed hydroelectric power generation as the number one source of renewable energy in Arizona. In 2022, 17% of Arizona’s total electricity generation came from renewable sources. Nearly 60% of this renewable energy came from solar PV and solar thermal sources when measuring combined outputs from both utility-scale and small-scale solar facilities.
Georgia
Over the past few years, there has been a notable increase in the production of solar power in Georgia. From 2019 to 2021, combined electricity generation from both utility-scale and small-scale solar PV sources more than doubled. In 2021, solar energy accounted for more than 33% of the state's renewable electricity production. That year, almost all of the solar energy came from utility-scale facilities. As of July 2023, Georgia ranked seventh in net solar PV power generation among all U.S. states.
New York
New York has consistently ranked among the top states for solar markets. The state has implemented policies aimed at encouraging investments in solar energy, such as net metering and the Long Island Power Authority's feed-in tariff. By the second quarter of 2023, New York had an installed solar capacity of 4,717 megawatts (MW), accounting for 4.75% of the state’s electric generation. New York aims to reach a solar energy installed capacity of 5,000 MW by 2025.
Virginia
In 2021, nearly 10% of Virginia's total electricity generation came from renewable resources. Solar energy accounted for 4% of all renewable energy generation that year, mostly coming from utility-scale facilities. Between July 2022 and July 2023, the state’s net generation from solar PV increased by almost 23%. Dominion Energy Virginia, the state’s largest utility company, has proposed more than a dozen new solar projects that will add 772 MW to the state’s current generation capacity.
Massachusetts
Renewables contributed almost 30% of Massachusetts' electricity generation in 2021, mostly coming from solar energy sources. Small-scale solar PV systems made up nearly 66% of the state's total solar capacity that year. On the other hand, more than 190 MW of capacity have been added from utility-scale facilities since January 2021. In July 2023, Massachusetts was ranked as the tenth state in net solar PV power generation.
Top 10 states with the highest percentage of electricity from solar
Based on data from the second quarter of 2023, the states that generate the largest percentage of their total electricity from solar are:
- California: 27.73%
- Nevada: 24.35%
- Massachusetts: 21.75%
- Vermont: 20.08%
- Hawaii: 17.69%
- Utah: 12.35%
- Rhode Island: 11.43%
- Arizona: 10.4%
- North Carolina: 9.46%
- Maine: 8.69%
California, once again, leads the ranking based on cumulative solar electric capacity. As of March 2024, the top 10 states by total solar electric capacity are:
- California - 46,874 MW
- Texas - 22,872 MW
- Florida - 13,912 MW
- North Carolina - 9,310 MW
- Arizona - 7,675 MW
- Nevada - 6,382 MW
- Georgia - 5,913 MW
- New York - 5,560 MW
- New Jersey - 5,276 MW
- Massachusetts - 5,070 MW
| 2021 | 2022 | 2023 (first half) | |
|---|---|---|---|
| Florida | 3 | 3 | 1 |
| California | 2 | 1 | 2 |
| Texas | 1 | 2 | 3 |
| Colorado | 12 | 26 | 4 |
| Nevada | 10 | 5 | 5 |
| New York | 9 | 4 | 6 |
| Ohio | 18 | 33 | 7 |
| Michigan | 14 | 19 | 8 |
| North Carolina | 8 | 15 | 9 |
| Oregon | 21 | 24 | 10 |
The future of solar
Solar power is expected to play a significant role in the future of electricity generation in the U.S. Here are some key points:
- In the next five years, the U.S. solar sector will nearly triple in magnitude. It is estimated that between 2023 and 2028, the solar industry will increase installation capacity by an additional 236 gigawatts-direct current.
- According to a study that the U.S. Department of Energy conducted in 2021, the U.S. is capable of generating 40% of its energy supply from solar power by 2035.
- According to the report, to reach the 40% target by 2035, the U.S. needs to install an average of 30 GW of solar capacity annually between 2021 and 2024, which is double the installation rate from the time the report was released. Subsequently, from 2025 to 2030, the U.S. should aim for an installation rate of 60 GW per year.
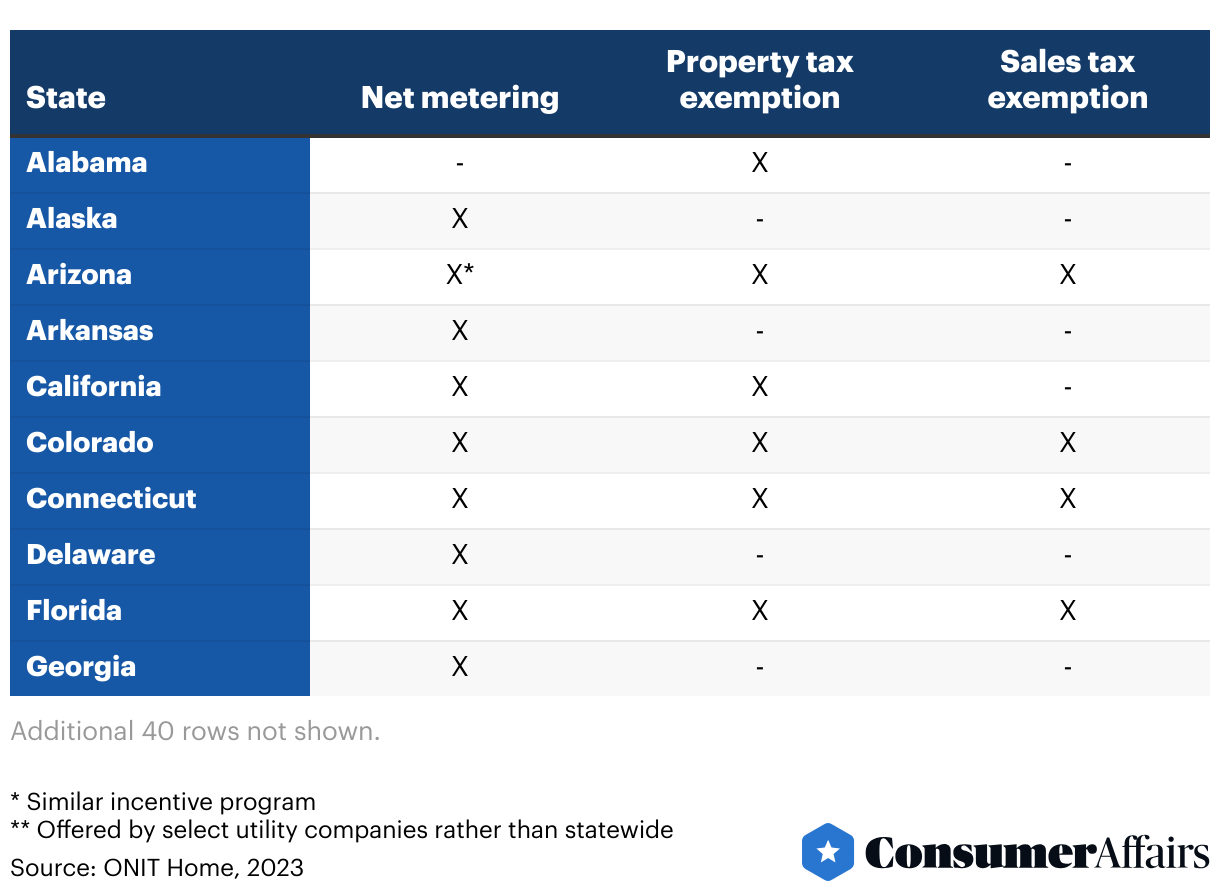
Solar incentives
Perhaps the most well-known solar government incentive in the U.S. is the investment tax credit (ITC), which is a solar tax credit offered by the federal government. U.S. homeowners can use the ITC to deduct 30% of their solar panel installation expenses from their federal income taxes, with no cap on the total amount deducted.
State and municipal governments, as well as local utility companies, may also offer different forms of incentives to encourage the use of solar PV energy. The table below summarizes the incentives available by state.
FAQ
What state in the U.S. has the largest solar installation capacity?
California leads the list of U.S. states for cumulative solar electric capacity at 46,874 MW.
What state in the U.S. has the largest solar PV generation relative to its population?
Based on recent data, Nevada leads the way when weighing net solar PV generation by the state’s population. Nevada’s net solar generation in 2022 was about 32,500 megawatt hours per 100,000 people.
Which states generate the largest percentage of their total electricity from solar?
The three states that generate the largest percentage of their total electricity from solar are California at 22.4% of its total electricity, Nevada at 18.2% and Hawaii at 18.2%.
Article sources
ConsumerAffairs writers primarily rely on government data, industry experts, and original research from other reputable publications to inform their work. Specific sources for this article include:
- U.S. Energy Information Administration, “Frequently Asked Questions (FAQs).” Accessed Oct. 27, 2023.
- Solar Energy Industries Association, “US Solar Market Insight: Executive Summary Q3 2023.” Accessed Oct. 27, 2023.
- U.S. Department of Agriculture, “Data Products: Population.” Accessed Oct. 27, 2023.
- U.S. Energy Information Administration, “Electric Power Monthly.” Accessed Oct. 28, 2023.
- U.S. Energy Information Administration, “More than half of new U.S. electric-generating capacity in 2023 will be solar.” Accessed Oct. 29, 2023.
- Solar Energy Industries Association, “North Carolina Solar.” Accessed Oct. 29, 2023.
- Solar Energy Industries Association, “Top 10 Solar States.” Accessed Oct. 29, 2023.
- U.S. Energy Information Administration, “Solar explained: Where solar is found and used.” Accessed Oct. 28, 2023.
- Solar Energy Industries Association, “Solar State By State.” Accessed Oct. 28, 2023.
- ShareAmerica, “Solar power is the future of American energy.” Accessed Oct. 28, 2023.
- Solar Energy Industries Association, “Solar Market Insight Report Q2 2023.” Accessed Oct. 28, 2023.
- PBS, “Solar could power 40 percent of U.S. electricity by 2035, report says.” Accessed Oct. 28, 2023.
- U.S. Energy Information Administration, “California.” Accessed Oct. 29, 2023.
- Environment America, “Solar power alongside California’s highways.” Accessed Oct. 29, 2023.
- U.S. Energy Information Administration, “Texas.” Accessed Oct. 29, 2023.
- Houston Chronicle, “Coal and natural gas give way as renewable power generation grows in Texas.” Accessed Oct. 29, 2023.
- U.S. Energy Information Administration, “Florida.” Accessed Oct. 29, 2023.
- Solar Energy Industries Association, “Florida Solar.” Accessed Oct. 29, 2023.
- U.S. Energy Information Administration, “North Carolina State Energy Profile.” Accessed Oct. 29, 2023.
- Solar Energy Industries Association, “Nevada Solar.” Accessed Oct. 29, 2023
- U.S. Energy Information Administration, “Nevada.” Accessed Oct. 29, 2023.
- U.S. Energy Information Administration, “Arizona.” Accessed Oct. 29, 2023.
- U.S. Energy Information Administration, “Georgia.” Accessed Oct. 30, 2023.
- New York State Energy Research and Development Authority, “New York Solar Study.” Accessed Oct. 29, 2023.
- Solar Energy Industries Association, “New York Solar” Accessed Oct. 29, 2023.
- U.S. Energy Information Administration, “Virginia.” Accessed Oct. 29, 2023.
- Electrek, “Virginia is about to get a big 772 MW solar boost.” Accessed Oct. 29, 2023.
- U.S. Energy Information Administration, “Massachusetts.” Accessed Oct. 30, 2023.
- EnergySage, “Solar panel cost in 2024: It may be lower than you think.” Accessed Oct. 11, 2023.
- ONIT Home, “Incentives for switching to solar in your state.” Accessed Oct. 20, 2023.
- U.S. Energy Information Administration, “Net generation, United States, all sectors, monthly.” Accessed March 8, 2024.
- Solar Energy Industries Association, “A New Reality: The Path Forward for California’s Solar and Storage Industry.” Accessed March 8, 2024.
- Solar Energy Industries Association, “Solar Data Cheat Sheet.” Accessed March 8, 2024.
- IEA, “Solar PV.” Accessed March 8, 2024.
Figures