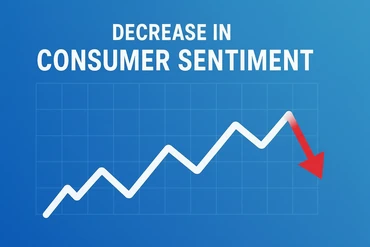
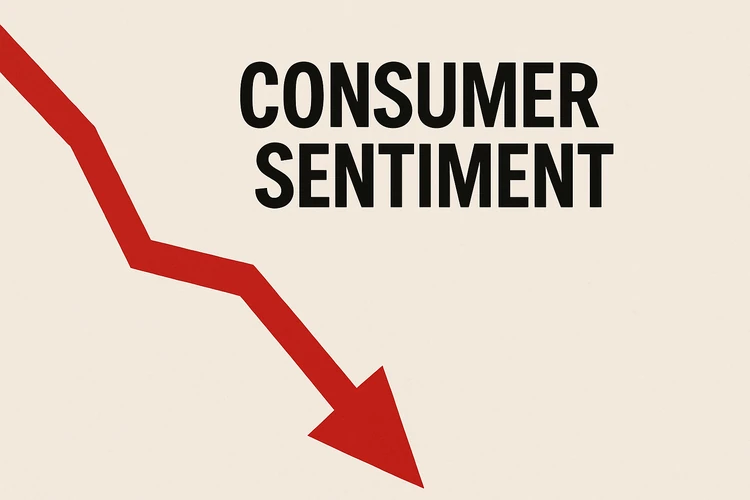
Nearly 4 in 10 households report lower income; over 70% expect a recession by next year.
Shoppers are cutting back across nearly all spending categories, except essentials like groceries and car-related expenses.
Tariffs, inflation, and shrinking savings are pushing consumers toward discounts, thrift, and smarter buying choices.
As summer 2025 winds down, U.S. consumers are facing tough financial decisions, according to KPMG’s latest Consumer Pulse report. With inflation climbing, household incomes shrinking, and renewed fears over tariffs, Americans are spending less, saving less, and thinking twice before making non-essential purchases.
“This isn’t just belt-tightening — it’s a complete rethink of value,” said Duleep Rodrigo, KPMG’s Consumer and Retail Sector Leader. “Today’s consumer wants purpose behind every dollar spent.”
The report, based on a survey of over 1,500 consumers, found that 39% of households say their income has dropped, nearly double the number from last summer. At the same time, over 70% believe a recession is coming within the next year, leading to widespread spending cutbacks.
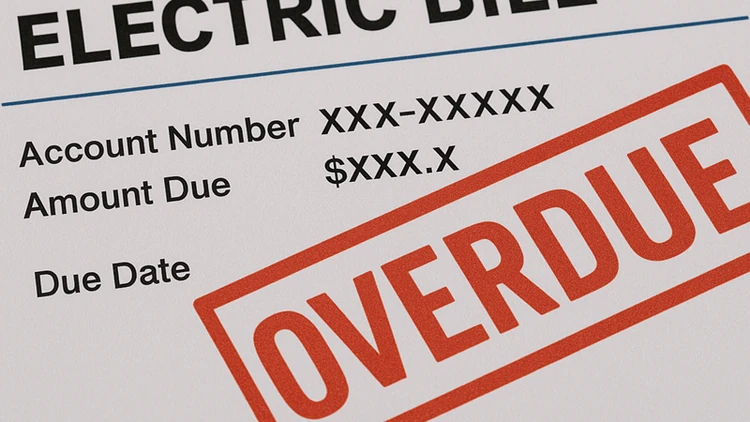
With tariffs back in the headlines, many consumers blame them for rising prices on food, clothing, electronics, and cars. Nearly 80% expect prices to go even higher, and half say they’re already cutting back or actively looking for deals to manage the impact.
“Tariffs are no longer background noise — they’re showing up on grocery receipts,” said Heather Rice, KPMG’s Consumer and Retail Tax Leader.
Smarter, sharper spending
Consumers aren’t necessarily giving up on spending — they’re just getting smarter. The report shows a shift toward value-first behavior:
50% of shoppers are cutting back overall
49% are chasing discounts and promotions
Thrift store apparel spending is up 2%
Fast food visits are up 26%, while casual dining is down 38%
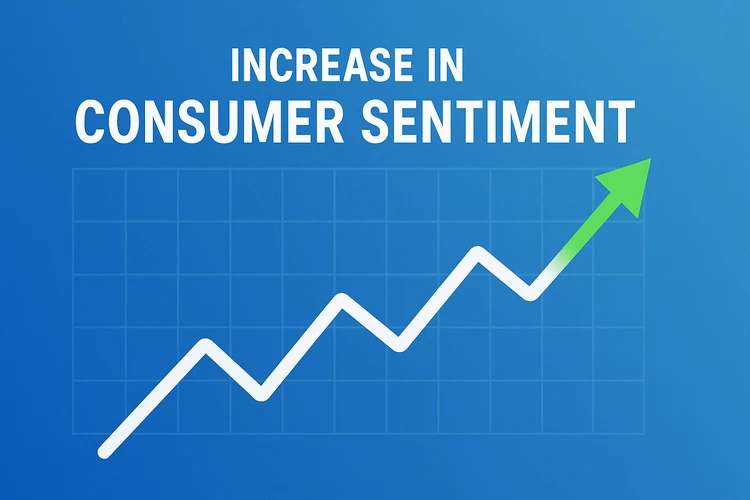
Only two categories are seeing growth: groceries and automotive.
“Consumers are still buying, but they’re buying with purpose,” Rodrigo said. “Relevance, trust, and tangible value are driving decisions.”
One-trip summer, wellness still a must
Even as budgets tighten, some spending remains sacred. Nearly 58% still plan summer travel, but they’re spending 7% less per trip and sticking to domestic destinations. It’s a “one trip instead of two” mindset, with restaurants and shopping trimmed to preserve the getaway.
Health and wellness also remain a priority:
Fitness and mental health are top concerns, especially for younger consumers
38% say they’re drinking less alcohol
Use of GLP-1 medications for weight loss or health is slowly rising, with 9% currently using them and 6% planning to start
“Wellness is evolving, not disappearing,” said Julia Wilson, KPMG’s Consumer Strategy Leader. “People are changing habits and focusing on what actually works.”
Smarter tech use, sharper expectations
Digitally, shoppers are moving toward direct-to-consumer (D2C) channels for basics like clothing, food, and personal care. They expect secure payments, fast shipping, and hassle-free returns. While social media shopping is growing, skepticism around advertising and data use is high:
“Consumers are open to tech — but only if it respects their privacy,” said Sam Ganga, KPMG’s AI and Cloud Leader. “Trust and transparency are make-or-break.”
The bottom line
Consumers in 2025 are not just spending less — they’re spending smarter. With shrinking incomes, rising prices, and a looming recession, they’re focused on what matters: value, relevance, and results. Brands that respond with empathy, clarity, and real utility are the ones most likely to survive the shift.